DevSecOps-Series: SonarQube | Part 9
installing, Running Sonarqube Integrate into Azure Pipelines and Examining The Test Results from The SonarQube Dashboard.


Topics we will cover:
What is SonarQube?
1. a. Components of the SonarQube Platform
1. b. Using of SonarQubeInstalling SonarQube Server with Postgresql Database
2. a. Prerequisite
2. b. Installation of SonarQube
2. c. Running SonarQube
2. d. Creating a SonarQube ProjectAs a result
The Fourth post: “DevSecOps-4: Running Sonarqube Scanner, OWASP Dependency Check, Jacoco, and Trivy in Jenkins CI/CD Pipeline.”
In this part series, going road a well about the installation, concepts, and usage of SonarQube, Trivy, OWASP Dependency Check, and JaCoCo. To talk about those briefly.
SonarQube is a leading code quality and security tool used by over 400,000 organizations worldwide. The tool supports 30+ programming languages and offers a range of code analysis features, including static code analysis, security testing, and tracking of best practices
1. It is a self-managed, automatic code review tool that helps for Clean Code
2 It is an open-source platform for continuous code quality inspection that includes static code analysis for identifying security vulnerabilities, as a Static Application Security Testing (SAST) tool
3. It also provides a dashboard for metrics and integration with development pipelines.
Trivy is a comprehensive and versatile security scanner. It is an open-source vulnerability scanner for containers and other artifacts, such as operating system packages and application dependencies. It scans container images and provides detailed reports on any vulnerabilities detected, including their severity and remediation steps
1. I will use Trivy as a Container Security Tool in this article series**.** It identifies security vulnerabilities in container images and file systems, supporting multiple package managers and CI/CD integration for enhanced container security
2. It also finds vulnerabilities & IaC misconfigurations, SBOM discovery, Cloud scanning, Kubernetes security risks, and more.
OWASP Dependency Check is a Software Composition Analysis (SCA) tool that attempts to detect publicly disclosed vulnerabilities contained within a project’s dependencies (4) and identifies known vulnerabilities in project dependencies (1). It scans project dependencies for known vulnerabilities and generates reports, helping developers address security issues in third-party libraries.
OWASP ZAP: is a free Dynamic Application Security Testing (DAST) tool. OWASP ZAP (Zed Attack Proxy) is an open-source web application security scanner that helps you identify and find security vulnerabilities in web applications (1).
JaCoCo stands for “Java Code Coverage”. It is a tool for measuring and reporting code coverage reports for Java projects. JaCoCo uses class file instrumentation to record execution coverage data. Class files are instrumented on the fly using a so-called Java agent (5). It based on Java byte code and therefore works also without source files.
1. What is SonarQube?
SonarQube is a self-managed, automatic code review tool that systematically helps you deliver Clean Code. SonarQube integrates into your existing workflow and detects issues in your code to help you perform continuous code inspections of your projects. The tool analyses 30+ different programming languages (Java, C#, JavaScript, TypeScript, CloudFormation, Terraform, Kotlin, Ruby, Go, Scala, Flex, Python, PHP, HTML, CSS, XML and VB.NET, etc.) Also, depending on the version we use, the rule sets of the languages come as predefined. It integrates them into your CI pipeline and DevOps platform to ensure that your code meets high-quality standards. (6)
SonarQube will help to increase the quality of the code going to the production environment by comparing the existing code in the CI flow with the previous code and static code.
The methods SonarQube uses to analyze the source code are;
Architecture Design
Unit Tests
Duplicate Code
Potential bugs
Complex code
Coding standards
Clean code
Sonar’s Clean as You Code approach eliminates many of the troubles that arise from reviewing code at a late stage in the development process. “**Clean as You Code: No pain, lots to gain” (**Bob Marley’s song came to my mind here, “No Woman, No Cry” :-)
a. Components of the SonarQube Platform
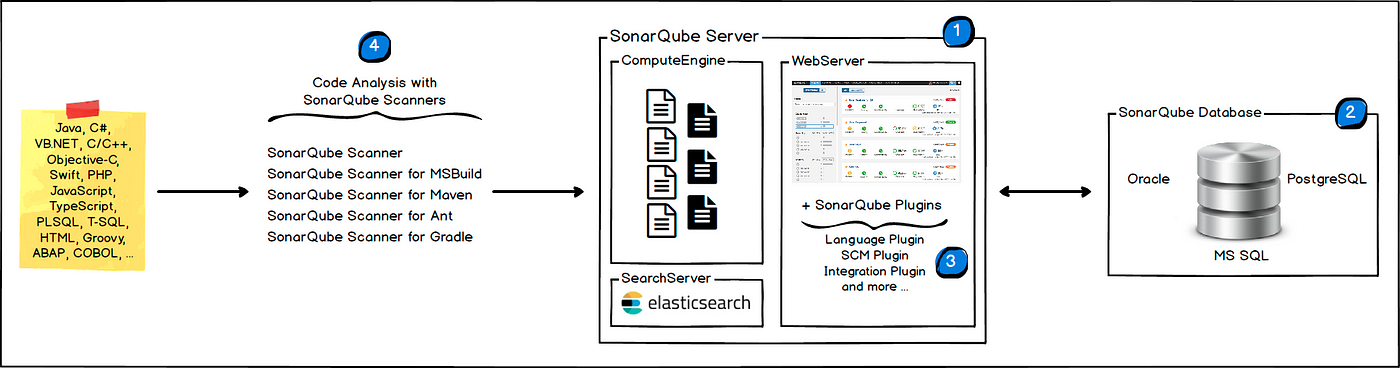
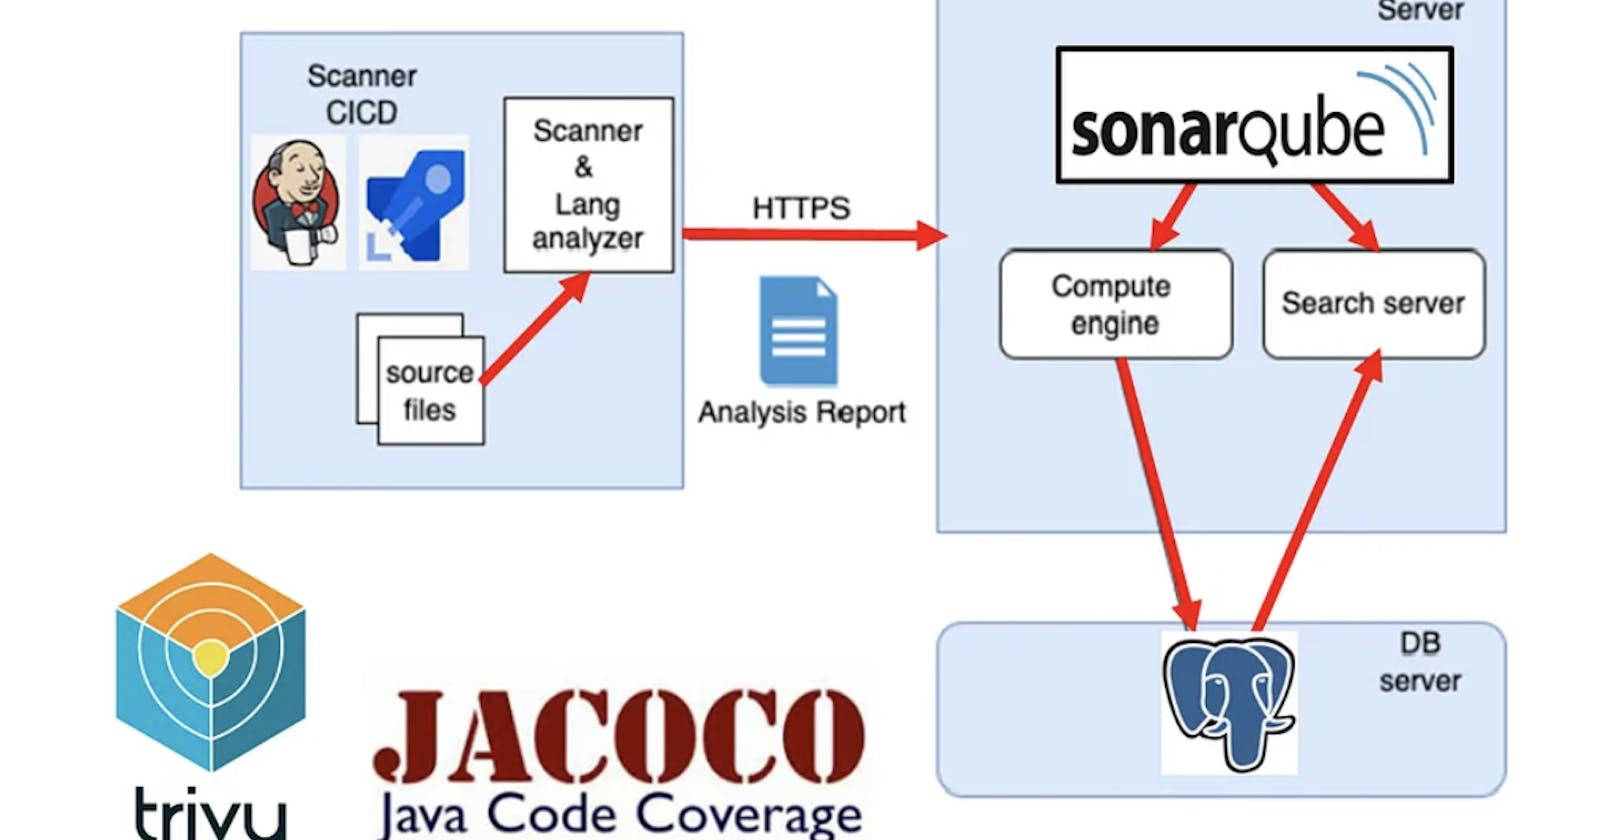
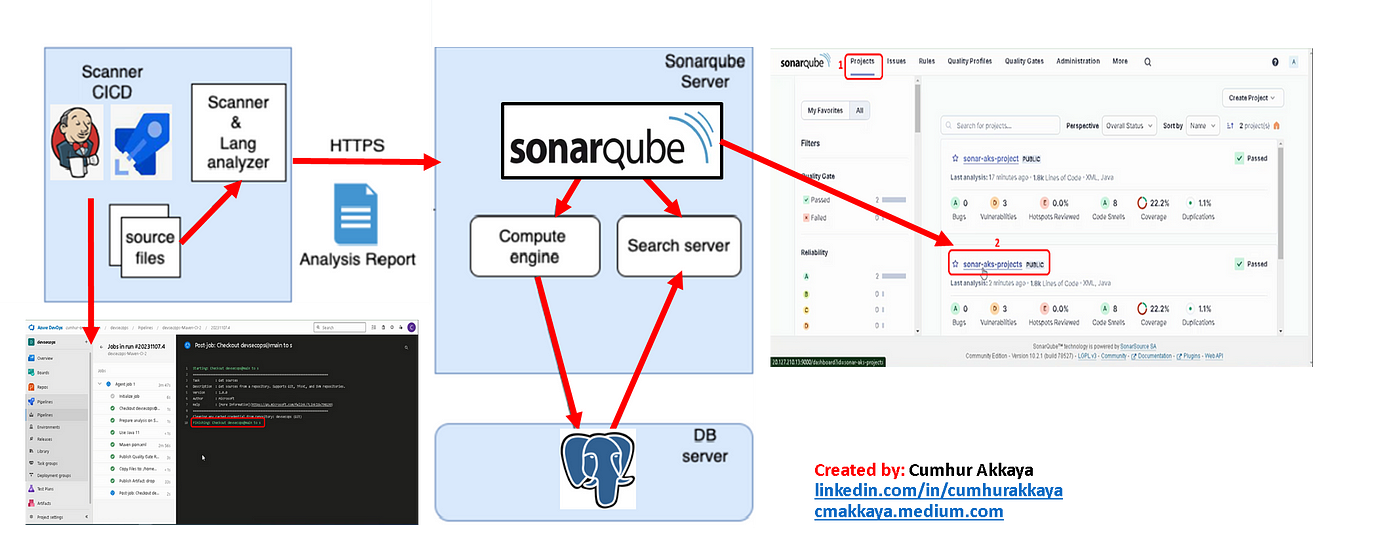
The SonarQube Platform is made of 4 components, as shown in Figure 1.
1. One SonarQube Server starting 3 main processes:
Web Server for developers, managers to browse quality snapshots and configure the SonarQube instance,
Search Server based on Elasticsearch to back searches from the UI,
Compute Engine Server in charge of processing code analysis reports and saving them in the SonarQube Database.
2. One SonarQube Database to store; the configuration of the SonarQube instance (security, plugins settings, etc.) and the quality snapshots of projects, views, etc.
3. Multiple SonarQube Plugins installed on the server, possibly including language, SCM, integration, authentication, and governance plugins
4. One or more SonarScanners running on your Build / Continuous Integration Servers to analyze projects
b. Using of SonarQube
The following schema shows how SonarQube integrates with other ALM (Application Lifecycle Management) tools and where the various components of SonarQube are used, as shown in Figure 2. (8)
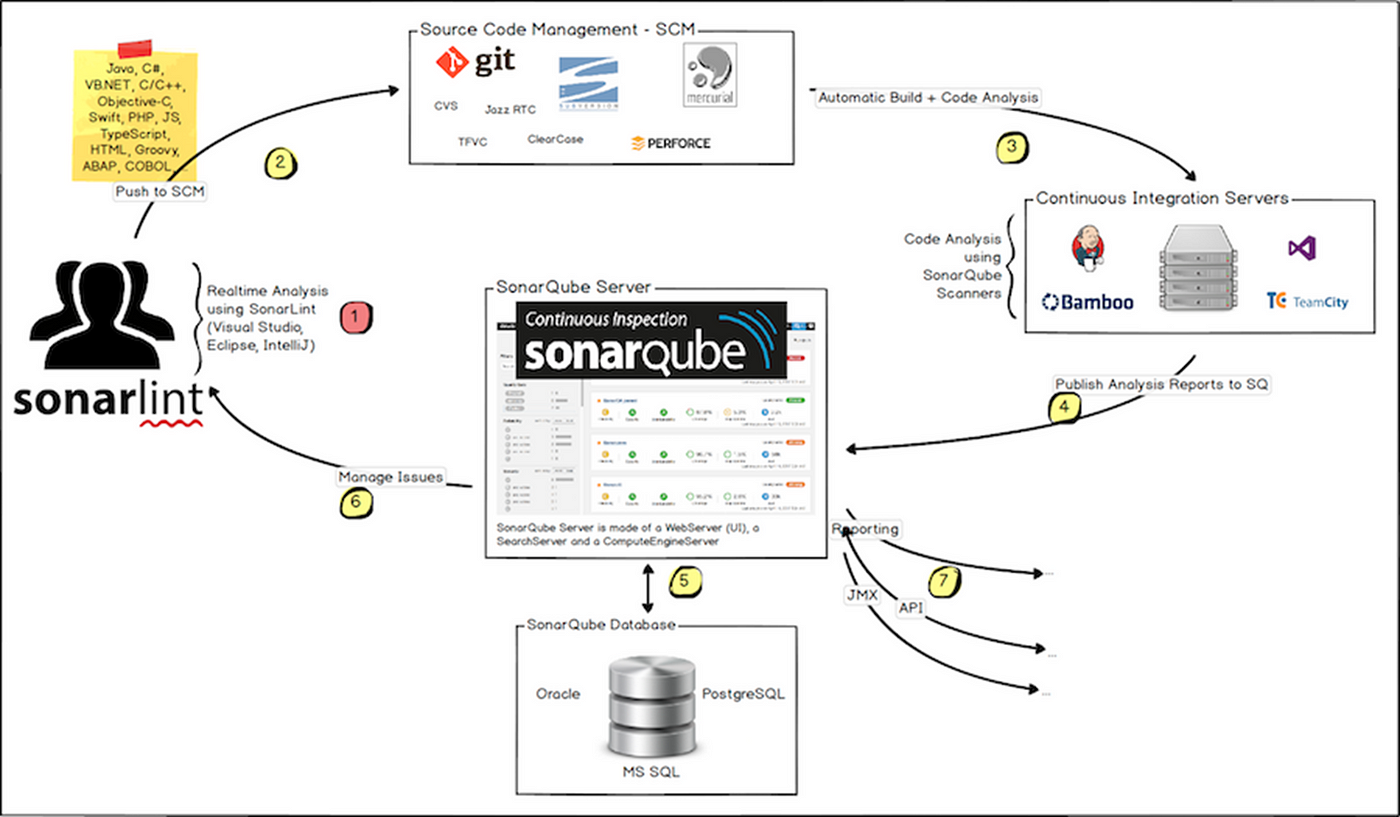
Developers code in their IDEs.
Developers push their code into their favorite SCM: git, SVN, TFVC, …
The Continuous Integration Server triggers an automatic build, and the execution of the SonarScanner required to run the SonarQube analysis.
The analysis report is sent to the SonarQube Server for processing.
SonarQube Server processes and stores the analysis report results in the SonarQube Database, and displays the results in the UI.
Developers review, comment, and challenge their issues to manage and reduce their Technical Debt through the SonarQube UI.
Managers receive Reports from the analysis.
2. Installing SonarQube
a.Prerequisite
You must be able to install Java (Oracle JRE or OpenJDK) on the machine where you plan to run SonarQube. You can download it from here.
b. Installation of SonarQube
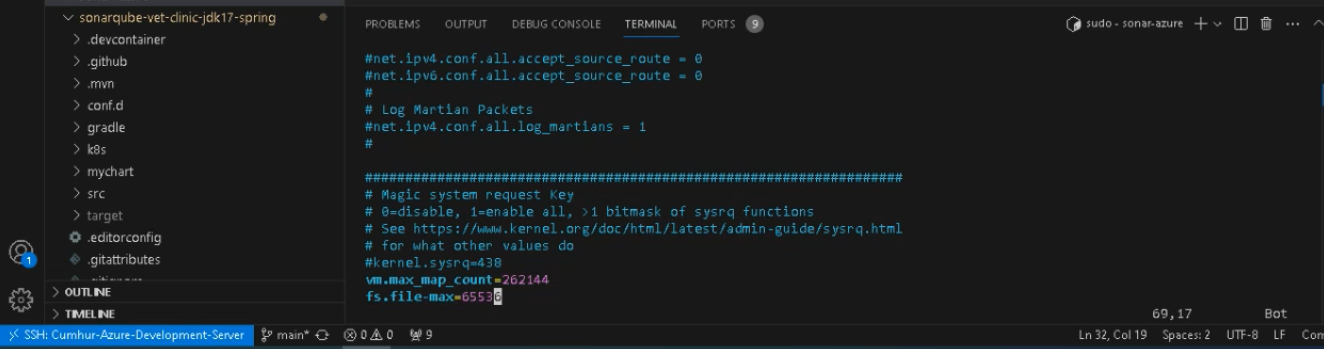
Before starting the installation, make the following settings, as shown in Figure 3.
sudo vi /etc/sysctl.conf
# Add the following lines to the bottom of that file;
vm.max_map_count=262144
fs.file-max=65536
# To make sure changes are getting into effect with the following command;
sudo sysctl -p
# Perform System update with the following command;
sudo apt update
Note: If Docker-Compose is not installed, install Docker-Compose with the following command(only for linux)
sudo apt install docker-compose -y
Now, you can install Sonarqube using the Docker-compose.yml file below. (9)
version: "3"
services:
  sonarqube:
    image: sonarqube:community
    depends_on:
      - db
    environment:
      SONAR_JDBC_URL: jdbc:postgresql://db:5432/sonar
      SONAR_JDBC_USERNAME: sonar
      SONAR_JDBC_PASSWORD: sonar
    volumes:
      - sonarqube_data:/opt/sonarqube/data
      - sonarqube_extensions:/opt/sonarqube/extensions
      - sonarqube_logs:/opt/sonarqube/logs
    ports:
      - "9000:9000"
  db:
    image: postgres:12
    environment:
      POSTGRES_USER: sonar
      POSTGRES_PASSWORD: sonar
    volumes:
      - postgresql:/var/lib/postgresql
      - postgresql_data:/var/lib/postgresql/data
volumes:
  sonarqube_data:
  sonarqube_extensions:
  sonarqube_logs:
  postgresql:
  postgresql_data:
Copy and save the entire content above, then execute the compose file using the Docker compose command below, as shown.
sudo docker-compose up -d
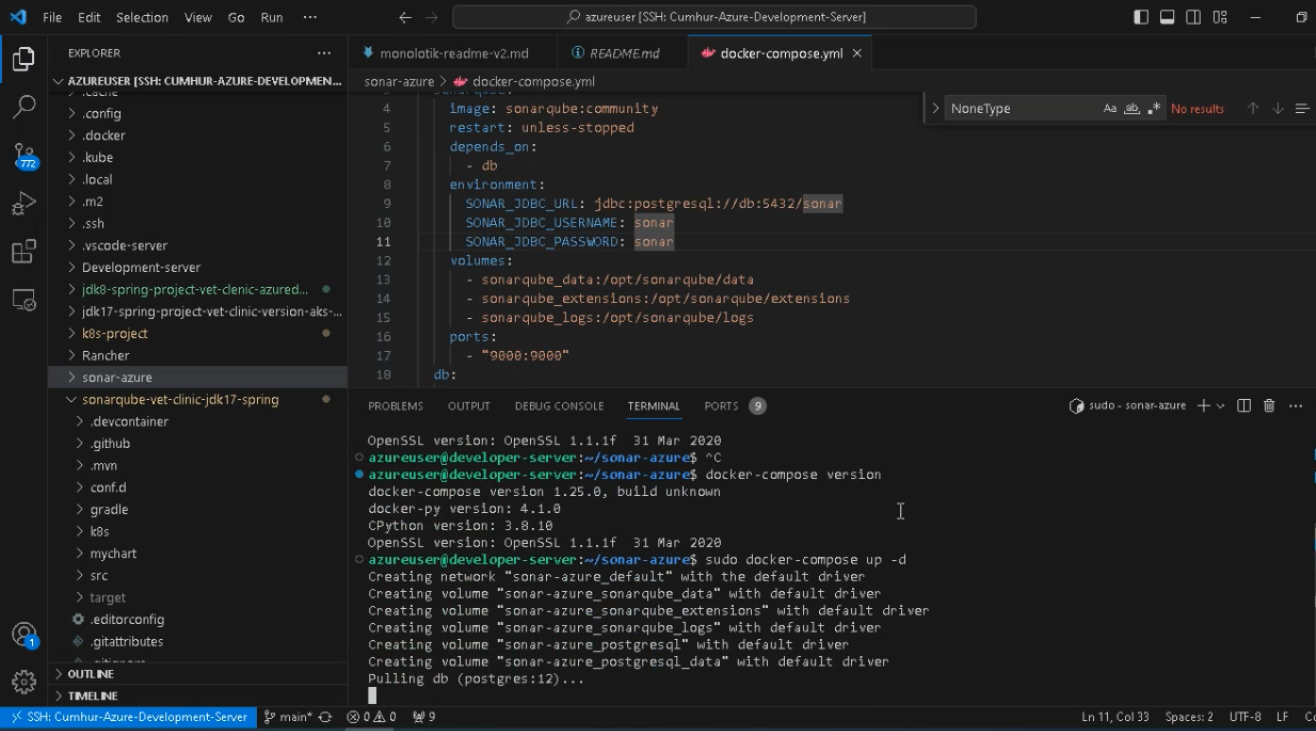
When the installation is completed you will see the following screen, as shown in.

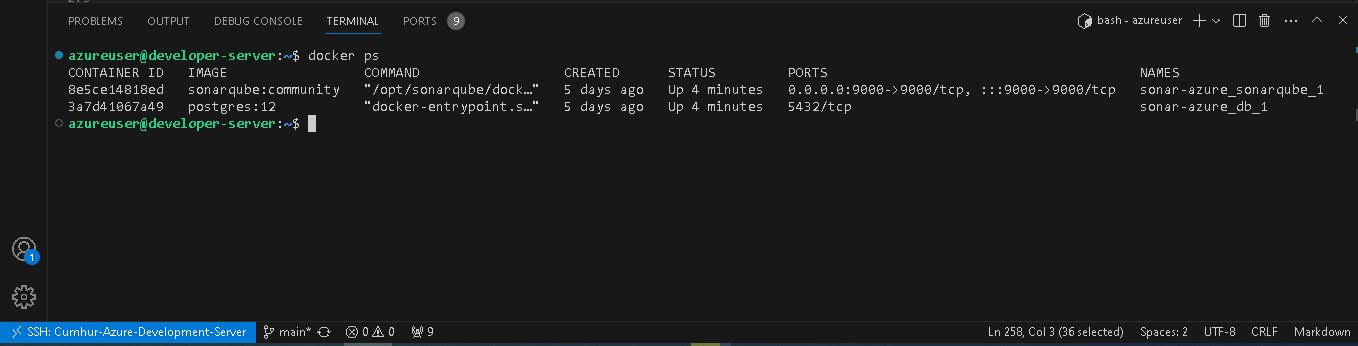
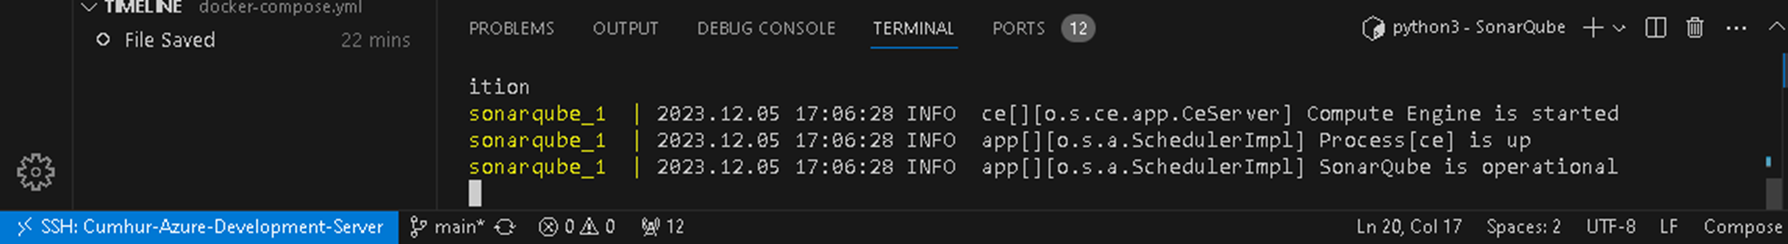
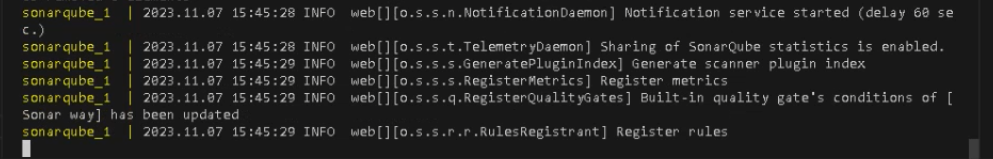
Make sure SonarQube is up and running by checking the logs by following the command:
sudo docker-compose logs --follow
When you see the message below, SonarQube is been installed successfully, as shown in Figure 6. To quit press “control + C”.
c. Running SonarQube
Now access sonarQube UI by going to the browser and entering the public DNS name with port 9000, as shown in Figure 7.
http://your_SonarQube_publicdns_name:9000/

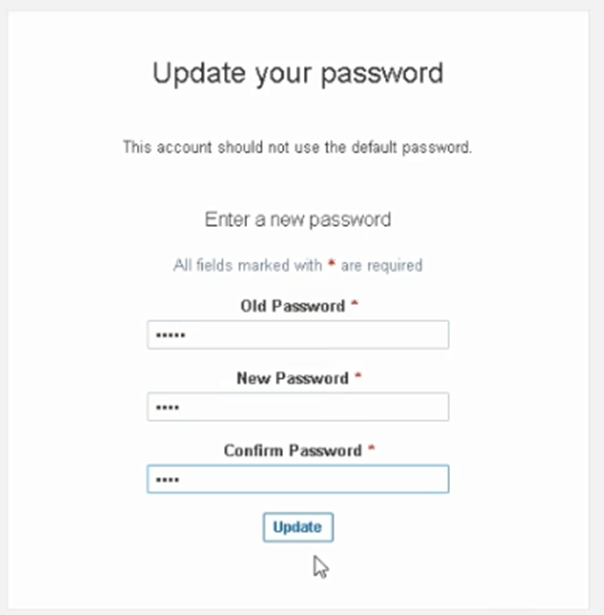
Click Log In and use the default “admin” as the username and password. Then, update your password, as shown in Figure 8.
SonarQube’s home page is opened, as shown in Figure 9.
d. Creating a SonarQube Project
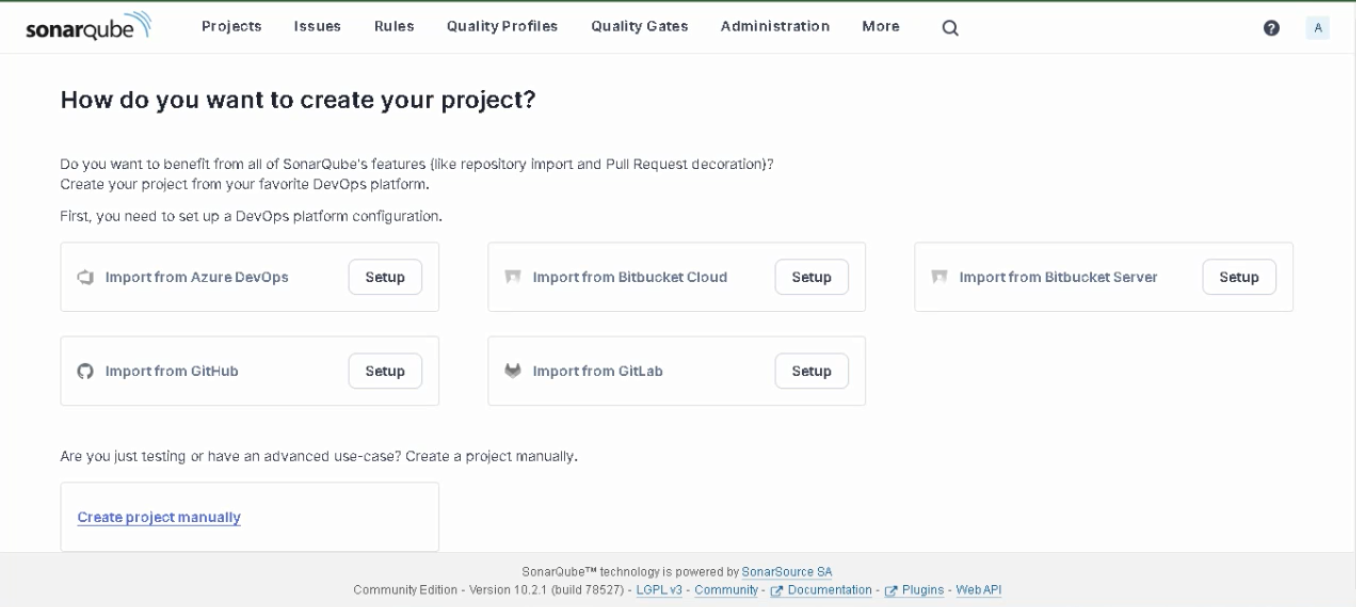
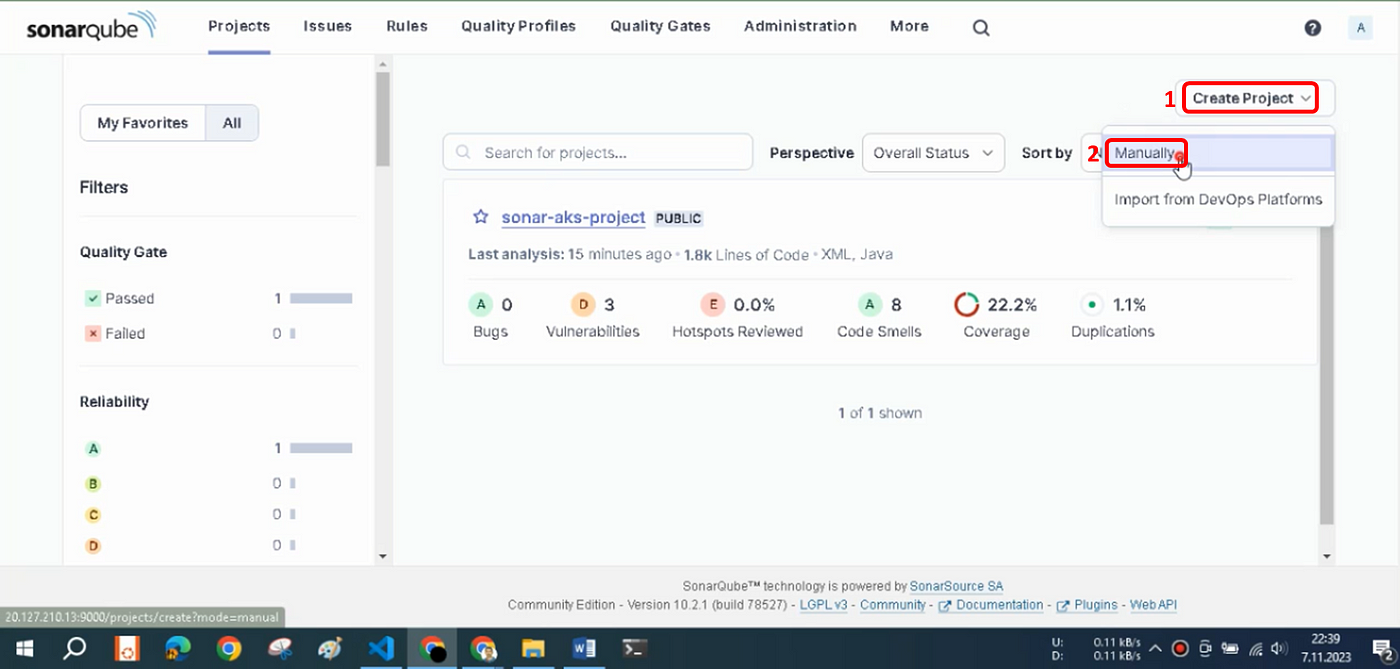
Click + in the upper right corner → “Create project”, as shown in Figure 10. (or below in the left corner → “Create project manually”, as shown in Figure 9.)
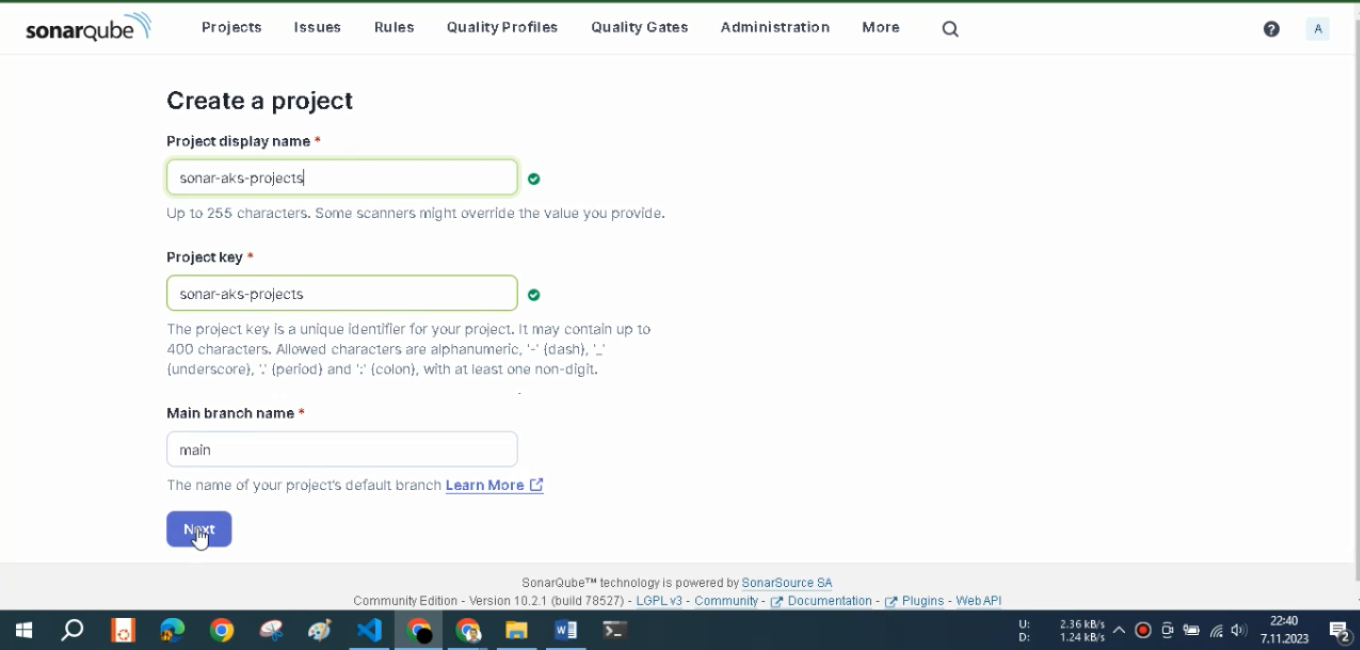
Enter the project key sonar-aks-projects and the project name sonar-aks-projects and click Next button, as shown in.
Select “Use the global setting” and click Create Projectbutton, as shown in Figure
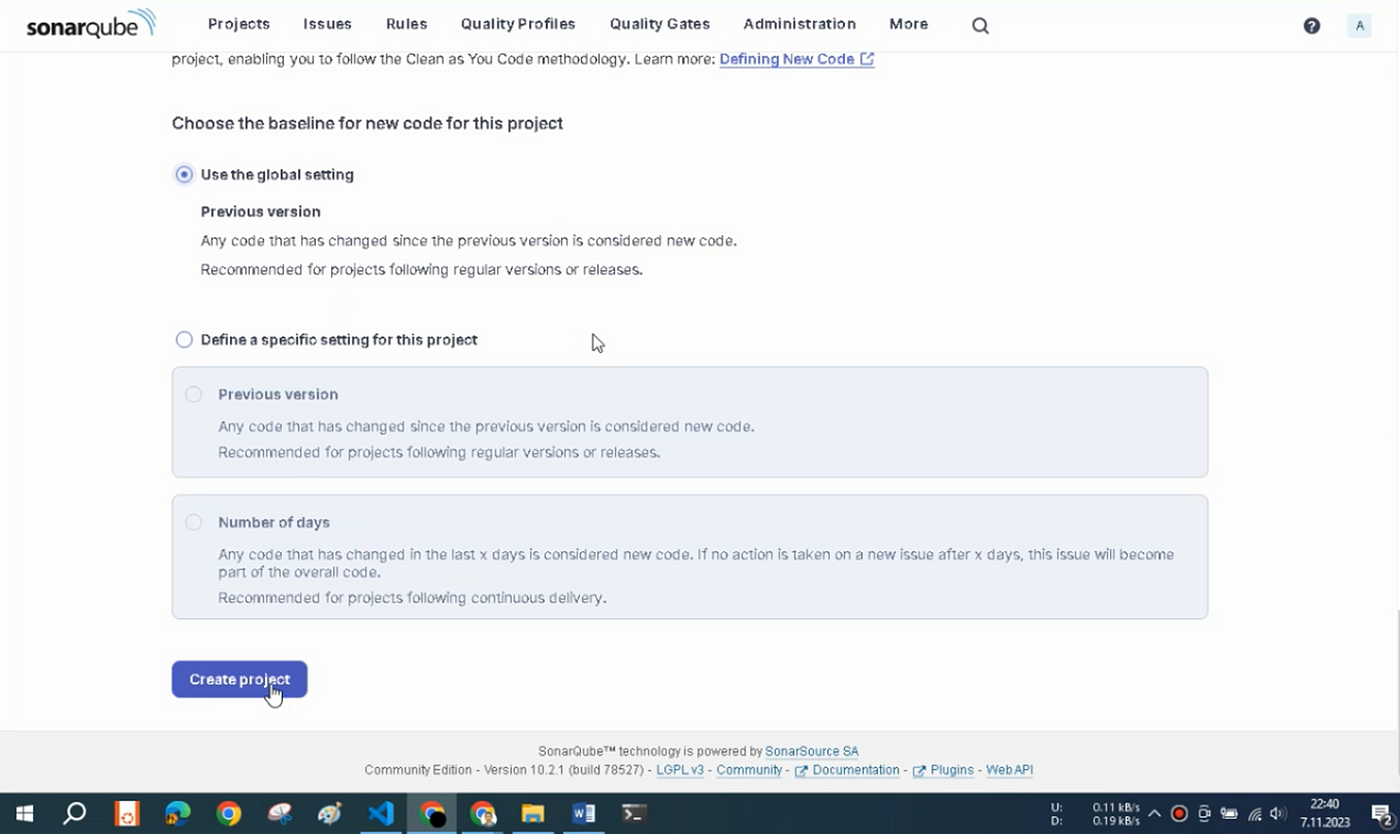
Our project has been created. Now, select “With Azure Pipeline” in the window that opens, as shown in.

The page with instructions about the project is opened, as shown in Figure 14. All the steps required to analyze your project by using SonarQube in Azure DevOps Pipelines are explained on this page that opens.
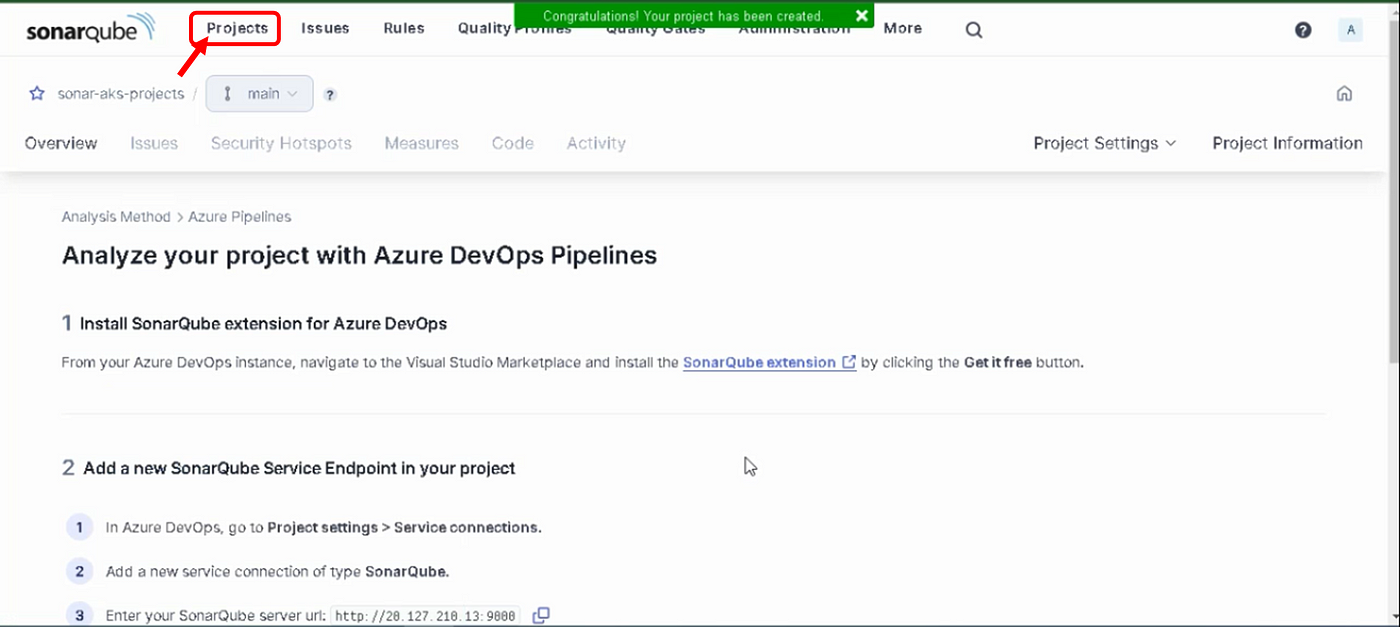
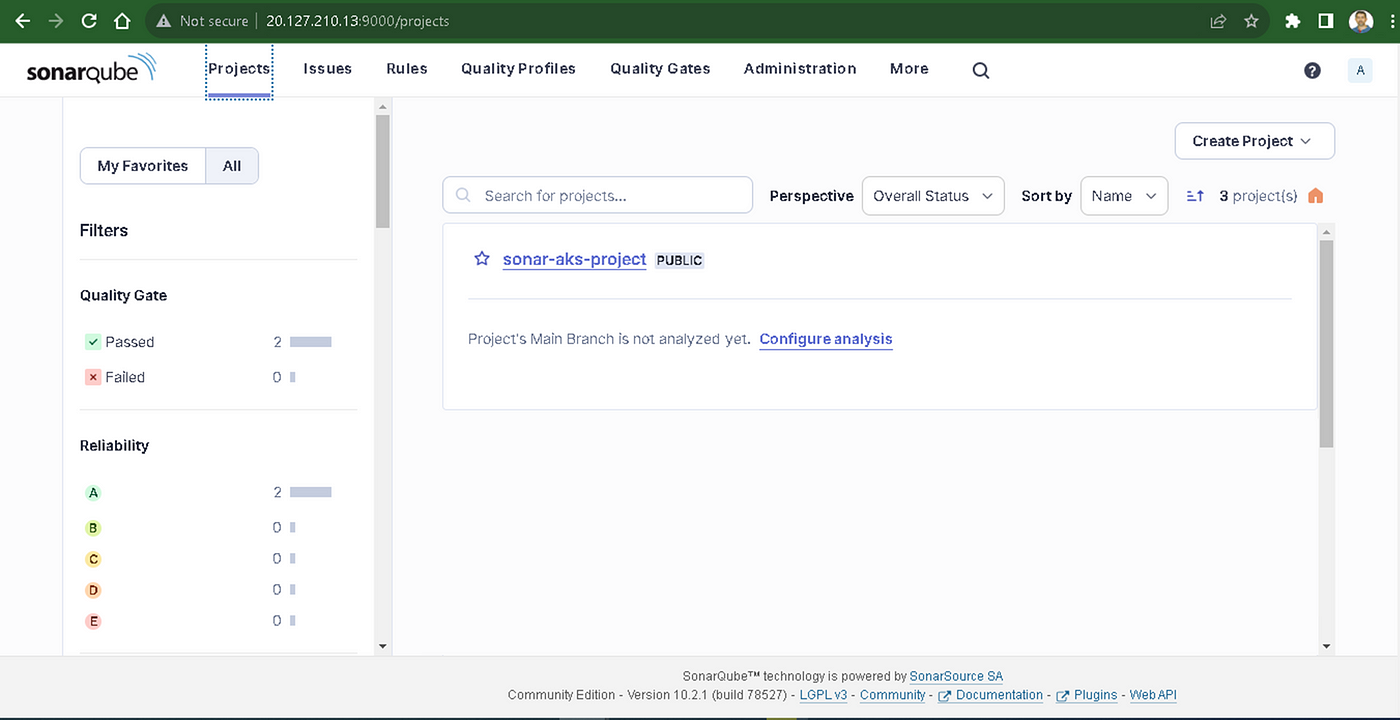
When we click on the project button as shown in Figure 14, we can see that the project has been created, as shown in Figure 15. However, to integrate with Azure DevOps Pipelines, we need to complete the steps mentioned in the next article.
3. As a result
the SonarQube Server and installed the SonarQube with the Postgresql Database into the Ubuntu in the cloud. Finally, we ran SonarQube and created a SonarQube project.
Your clap, follow, or subscribe, they help my articles to reach the broader audience. Thank you in advance for them.
4. Part Integrate
Integrate the SonarQube Server into the Azure Pipeline that runs a microservice Java application in it. Then, we will create and run the Azure pipeline for SonarQube analysis. Finally, we will examine and evaluate the test results in the Sonarqube dashboard. We will do them practically and step by step.
SonarQube, Trivy, OWASP Dependency Check, OWASP ZAP, and JaCoCo. Also, I will show you step-by-step how to use them in practice, with hands-on.
In this article, we will integrate the SonarQube Server with Postgresql Database into the Azure Pipeline that runs a microservice Java application in it. Then, we will create and run the Azure pipeline for SonarQube analysis. Finally, we will examine and evaluate the test results in the SonarQube dashboard.
Your clapping, following, or subscribing helps my articles to reach a broader audience. Thank you in advance for them.
In this article series, I will talk about the installation, concepts, and usage of SonarQube, Trivy, OWASP Dependency Check, and JaCoCo. To talk about them briefly;
SonarQube is a leading code quality and security tool used by over 400,000 organizations worldwide. The tool supports 30+ programming languages and offers a range of code analysis features, including static code analysis, security testing, and tracking of best practices (1a). It is a self-managed, automatic code review tool that helps for Clean Code (1b). It is an open-source platform for continuous code quality inspection that includes static code analysis for identifying security vulnerabilities, as a Static Application Security Testing (SAST) tool (2). It also provides a dashboard for metrics and integration with development pipelines.
Trivy is a comprehensive and versatile security scanner (3). It is an open-source vulnerability scanner for containers and other artifacts, such as operating system packages and application dependencies. It scans container images and provides detailed reports on any vulnerabilities detected, including their severity and remediation steps (2). I will use Trivy as a Container Security Tool in this article series**.** It identifies security vulnerabilities in container images and file systems, supporting multiple package managers and CI/CD integration for enhanced container security (4). It also finds vulnerabilities & IaC misconfigurations, SBOM discovery, Cloud scanning, Kubernetes security risks, and more.
OWASP Dependency Check is a Software Composition Analysis (SCA) tool that attempts to detect publicly disclosed vulnerabilities contained within a project’s dependencies (5) and identifies known vulnerabilities in project dependencies (2). It scans project dependencies for known vulnerabilities and generates reports, helping developers address security issues in third-party libraries.
OWASP ZAP: is a free Dynamic Application Security Testing (DAST) tool. OWASP ZAP (Zed Attack Proxy) is an open-source web application security scanner that helps you identify and find security vulnerabilities in web applications (2).
JaCoCo stands for “Java Code Coverage”. It is a tool for measuring and reporting code coverage reports for Java projects. JaCoCo uses class file instrumentation to record execution coverage data. Class files are instrumented on the fly using a so-called Java agent (6). It based on Java byte code and therefore works also without source files.
Finally, lets create SonarQube project.
Integrating SonarQube into Azure DevOps Pipelines
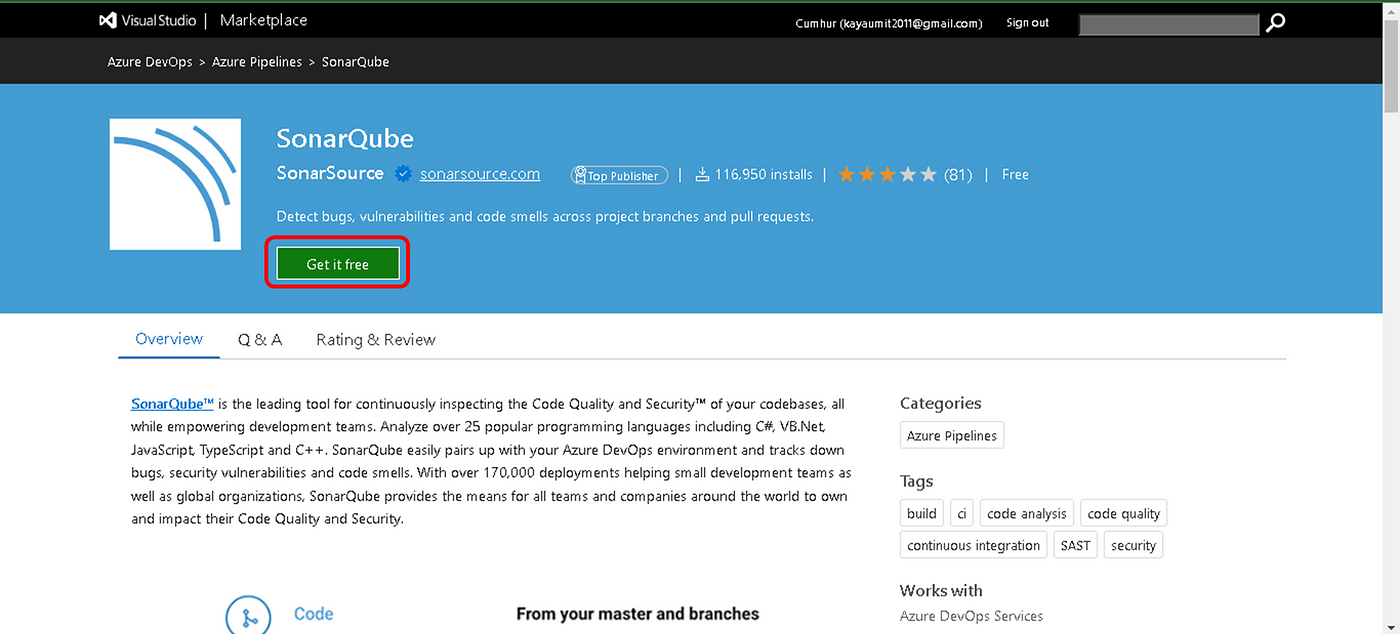
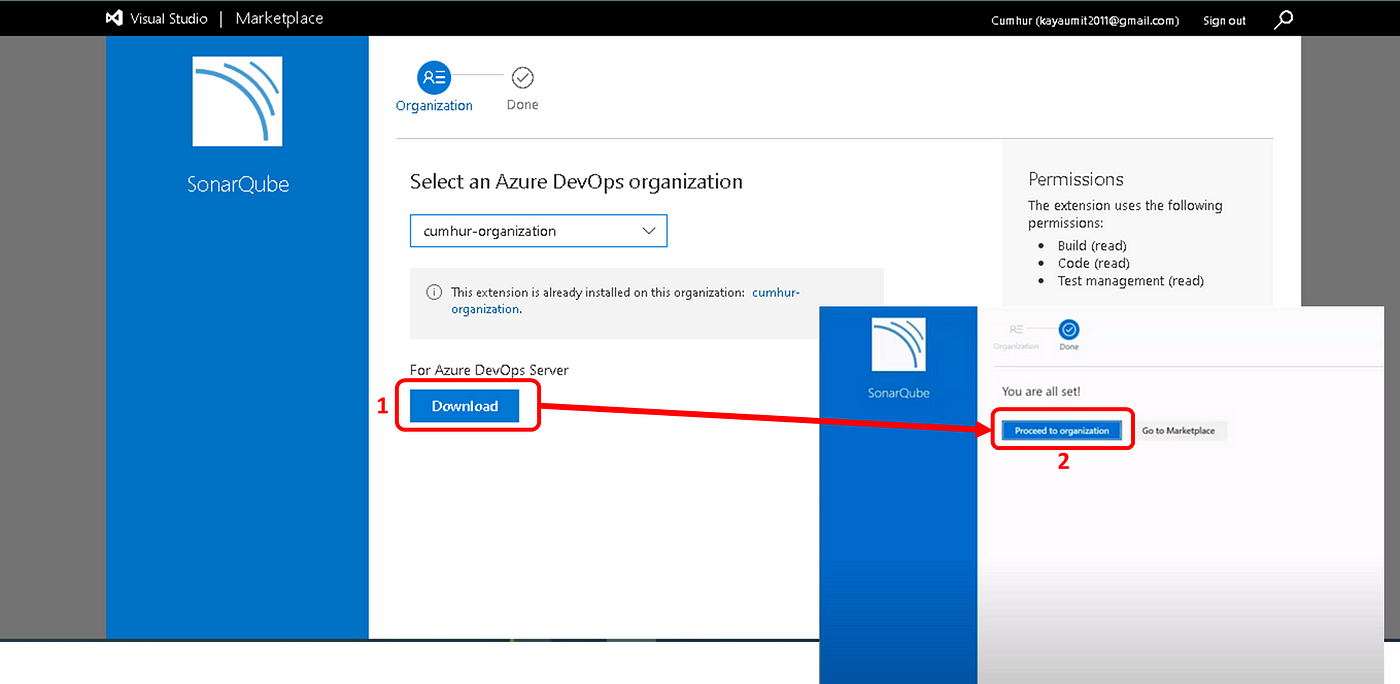
1. Install SonarQube extension for Azure DevOps
From your Azure DevOps instance, navigate to the Visual Studio Marketplace and install the SonarQube extension by clicking the Get it free button, as shown.
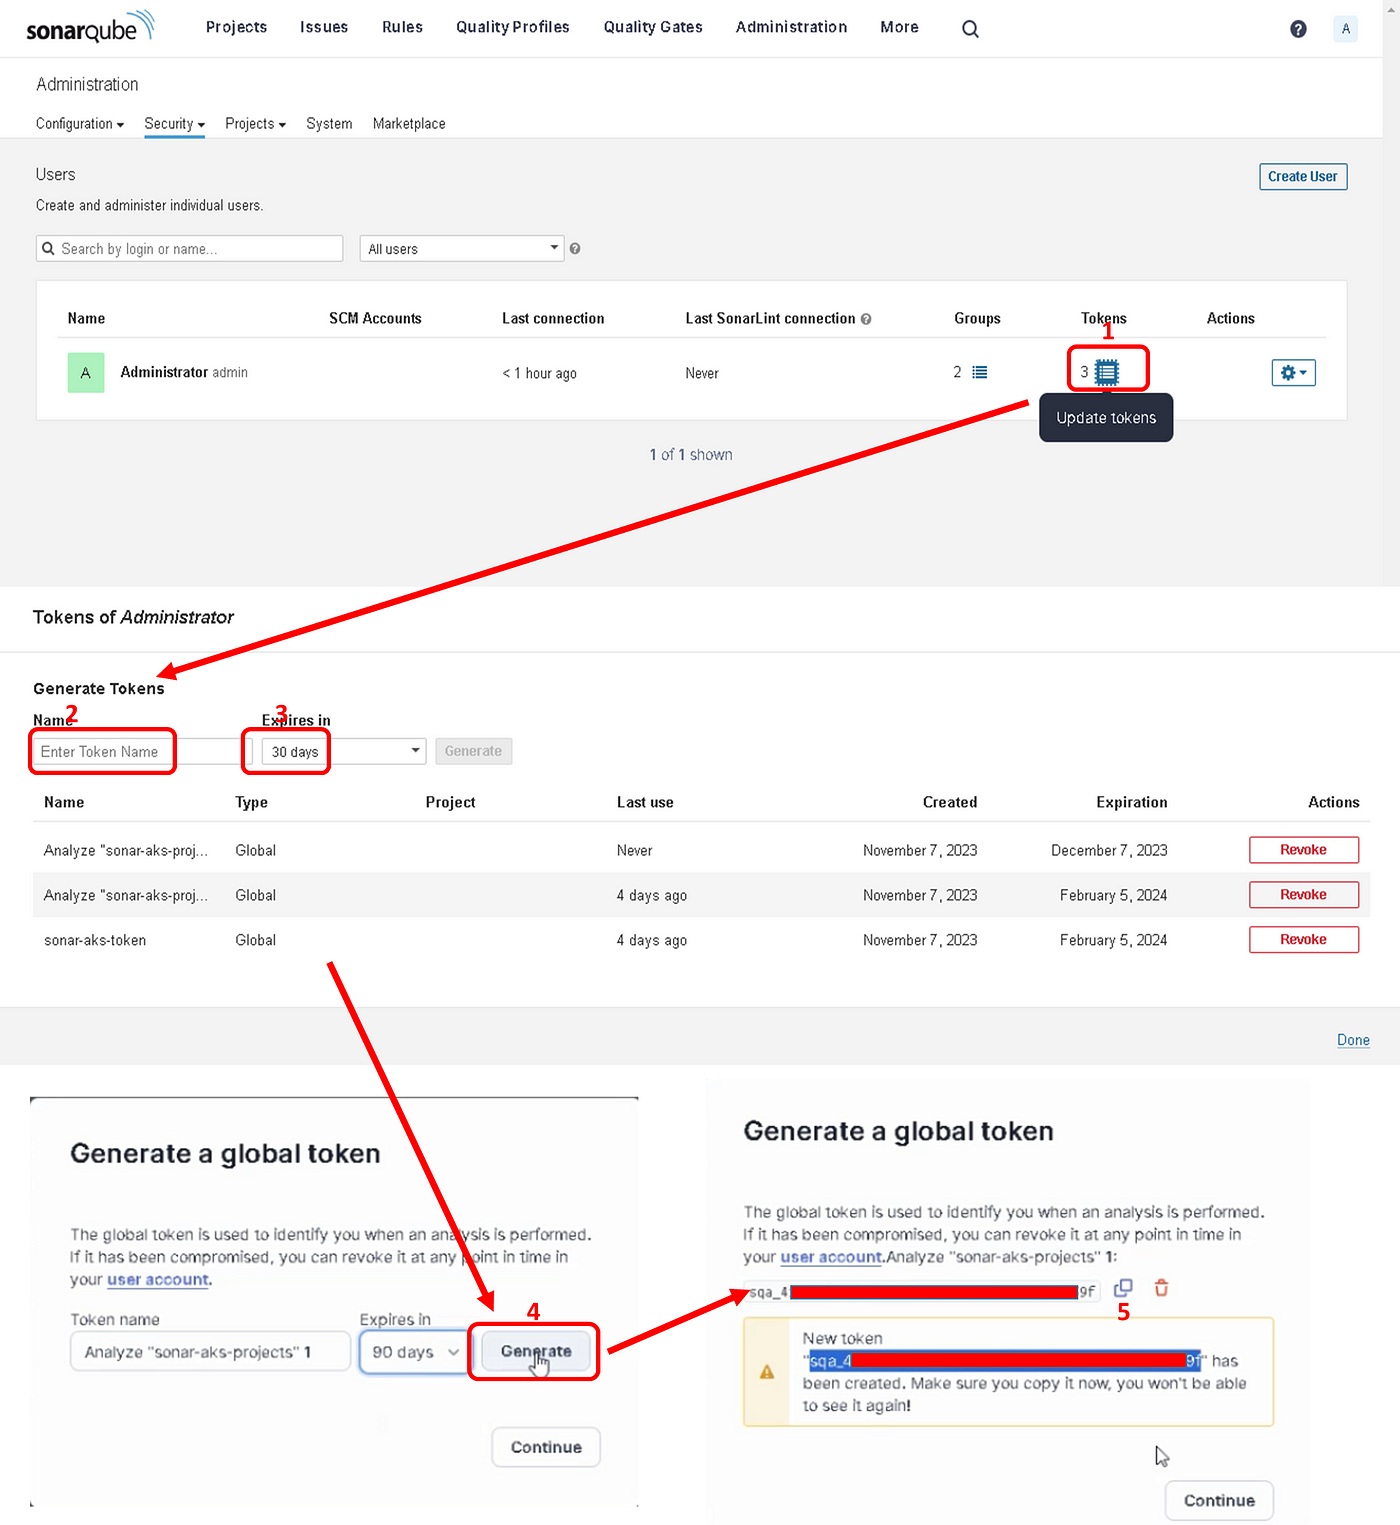
1. Generating a New Token for Your Project
Navigate to “SonarQube server > Administration > Security > Users”, and then click on the tokens icon, as shown in Figure 3.
Then, give a name to the token: sonar-aks-project and click Generate
Copy the created token, it will look like this: sonar-aks-project-token: xxxxxxxxxx, you will need it later. Finally, click Continue to proceed.
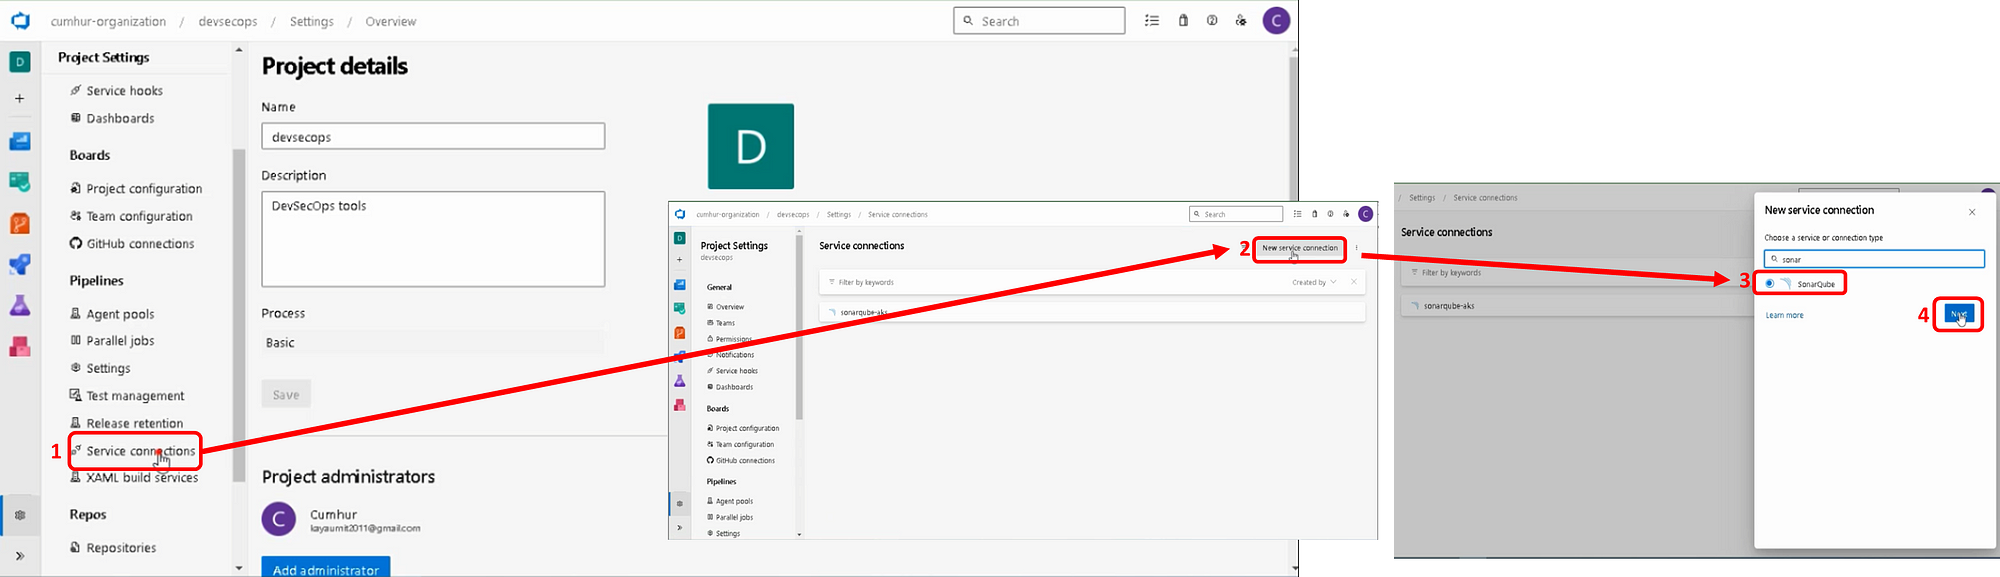
1. Add a New SonarQube Service Endpoint to Your Azure DevOps Project
In Azure DevOps, go to Project settings > Service connections. (7)
Add a new service connection of type SonarQube, as shown in Figure 4.
Enter your SonarQube server URL, as shown in Figure 16. It is for me: http://20.127.210.13:9000
Enter an existing token, Enter a memorable connection name. Create the service connection, as shown.
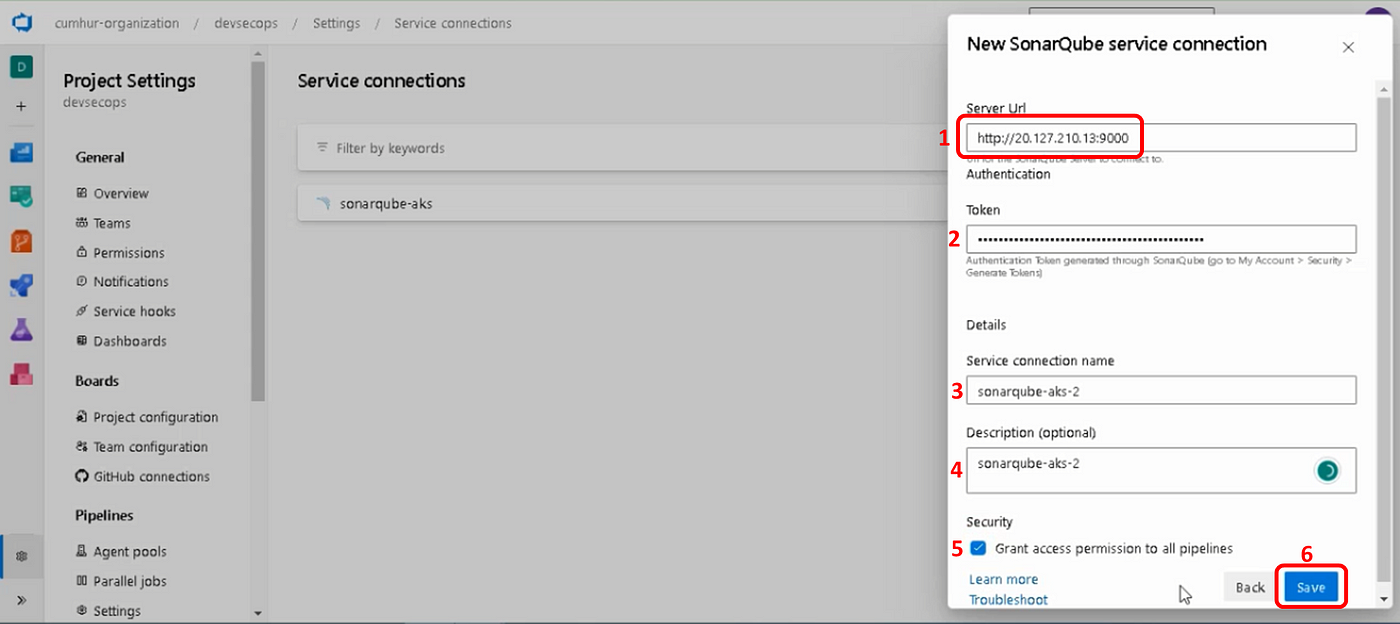
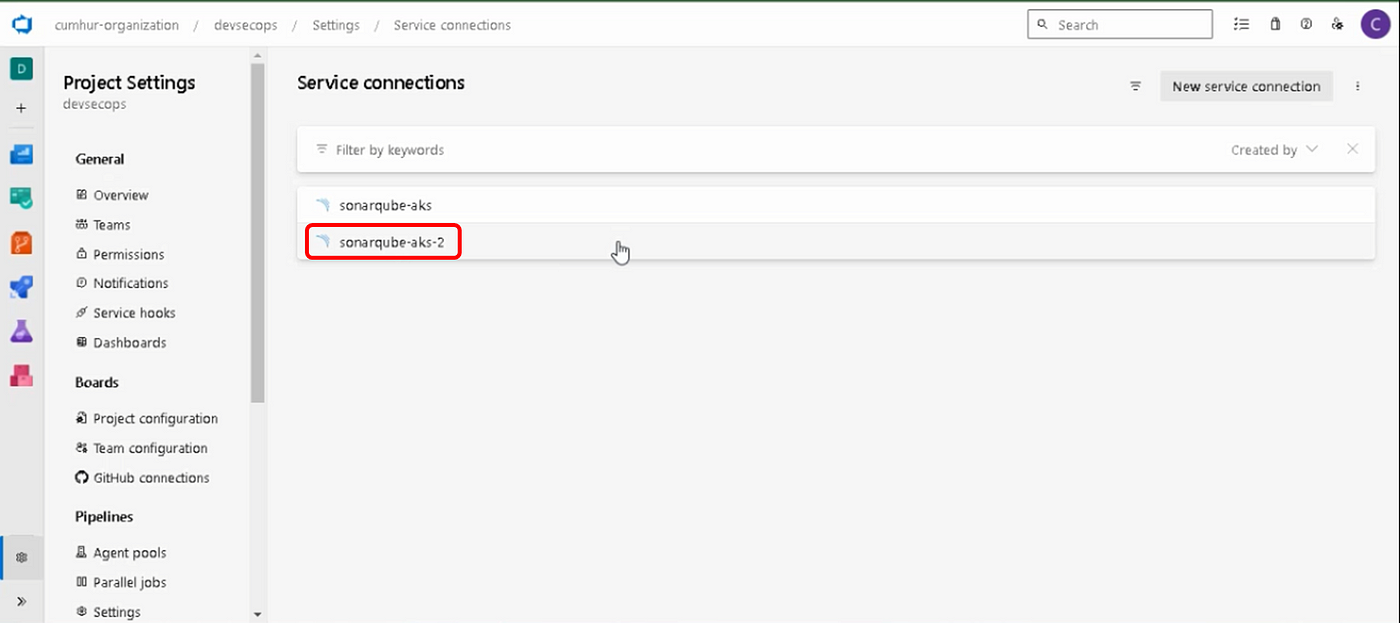
Our service connection named “sonarqube-aks-2" has been created, as shown in.
2. Configuring Azure Pipelines
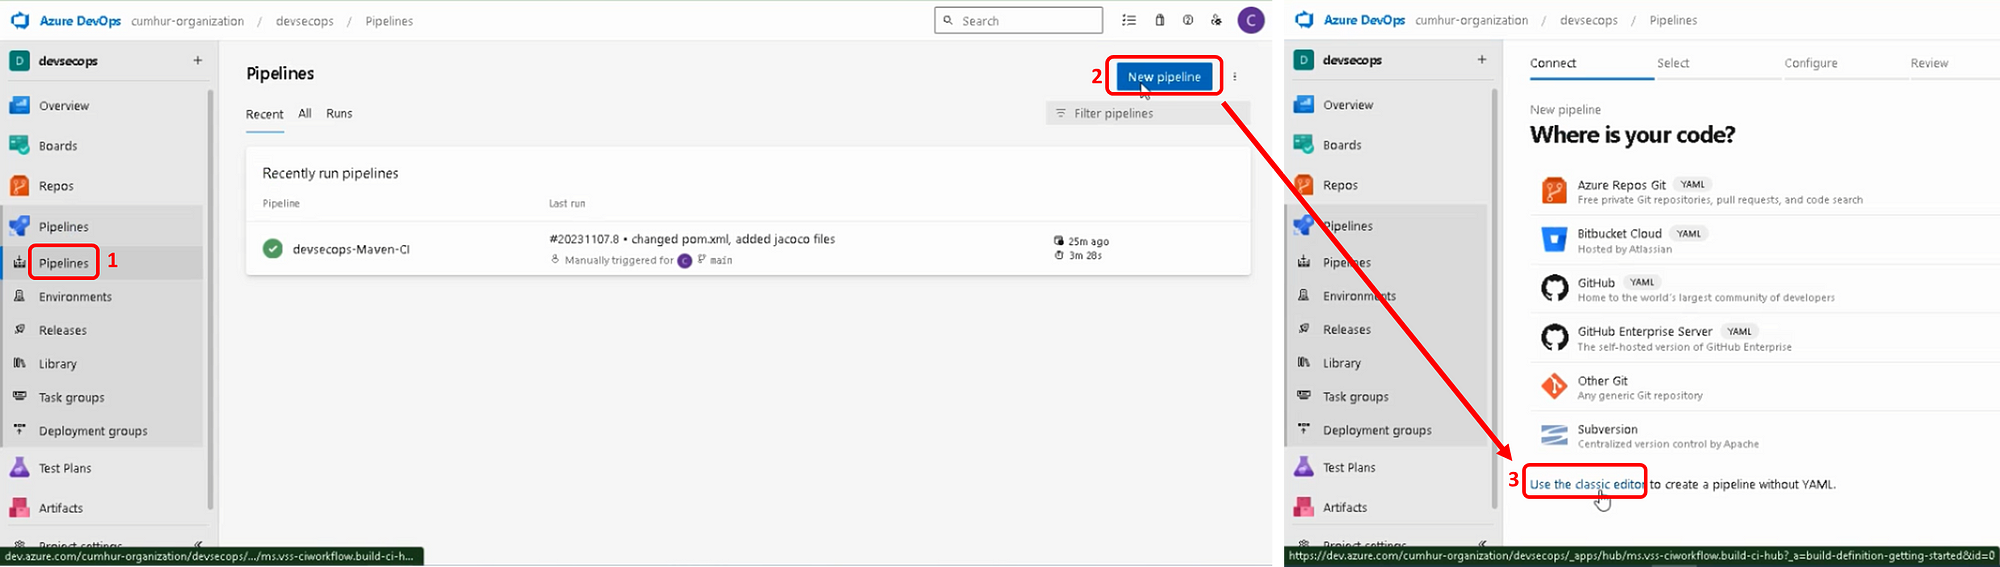
a. Creating an Azure Pipeline
Click on the “New pipeline” button, then, “Use the classic editor” button in order to create an Azure Pipeline for our Java project, as shown in Figure 7.
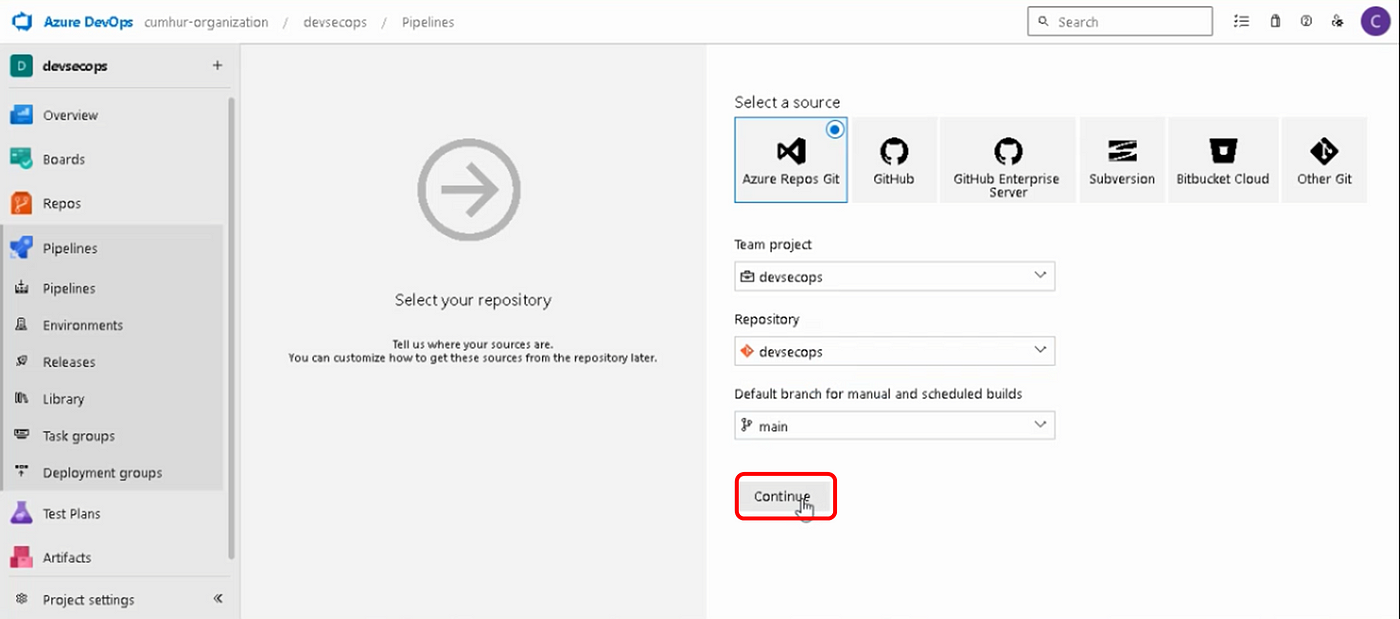
b. Selecting Your Source Code Repo
Select your Source Code Repo containing our Java project, as shown in Figure 8. For me, I selected the “devsecops” repository in Azure Repos.
c. Adding and Preparing “Maven” Task
Add a Maven task for our Java project, as shown in Figure 9.
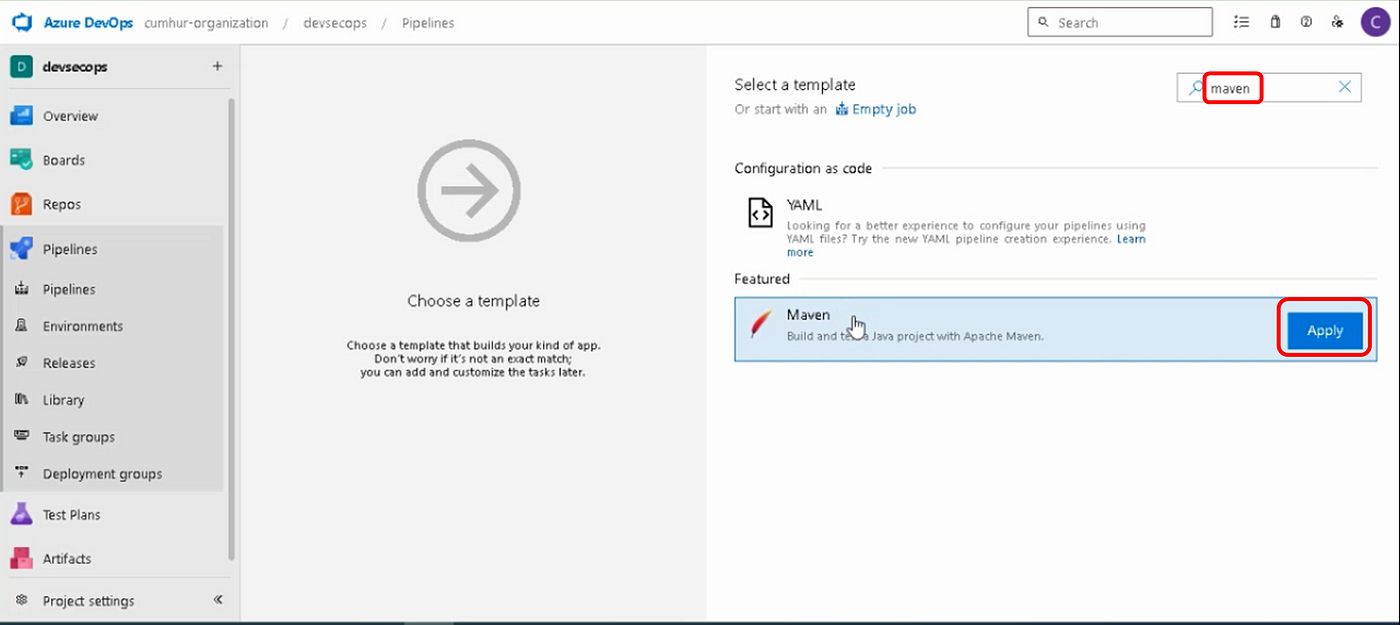
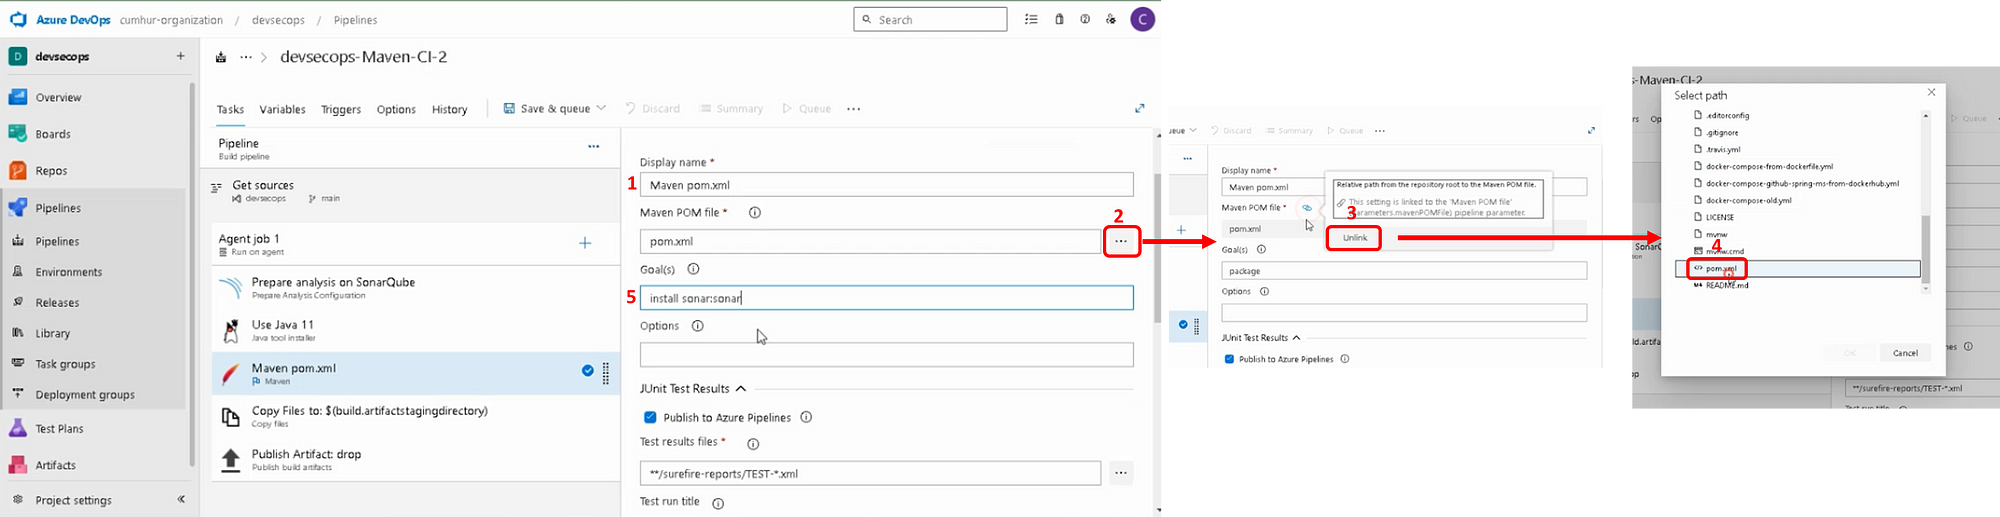
Then, configure the Maven task.
Note: Don’t forget to specify the path to the pom.xml file.
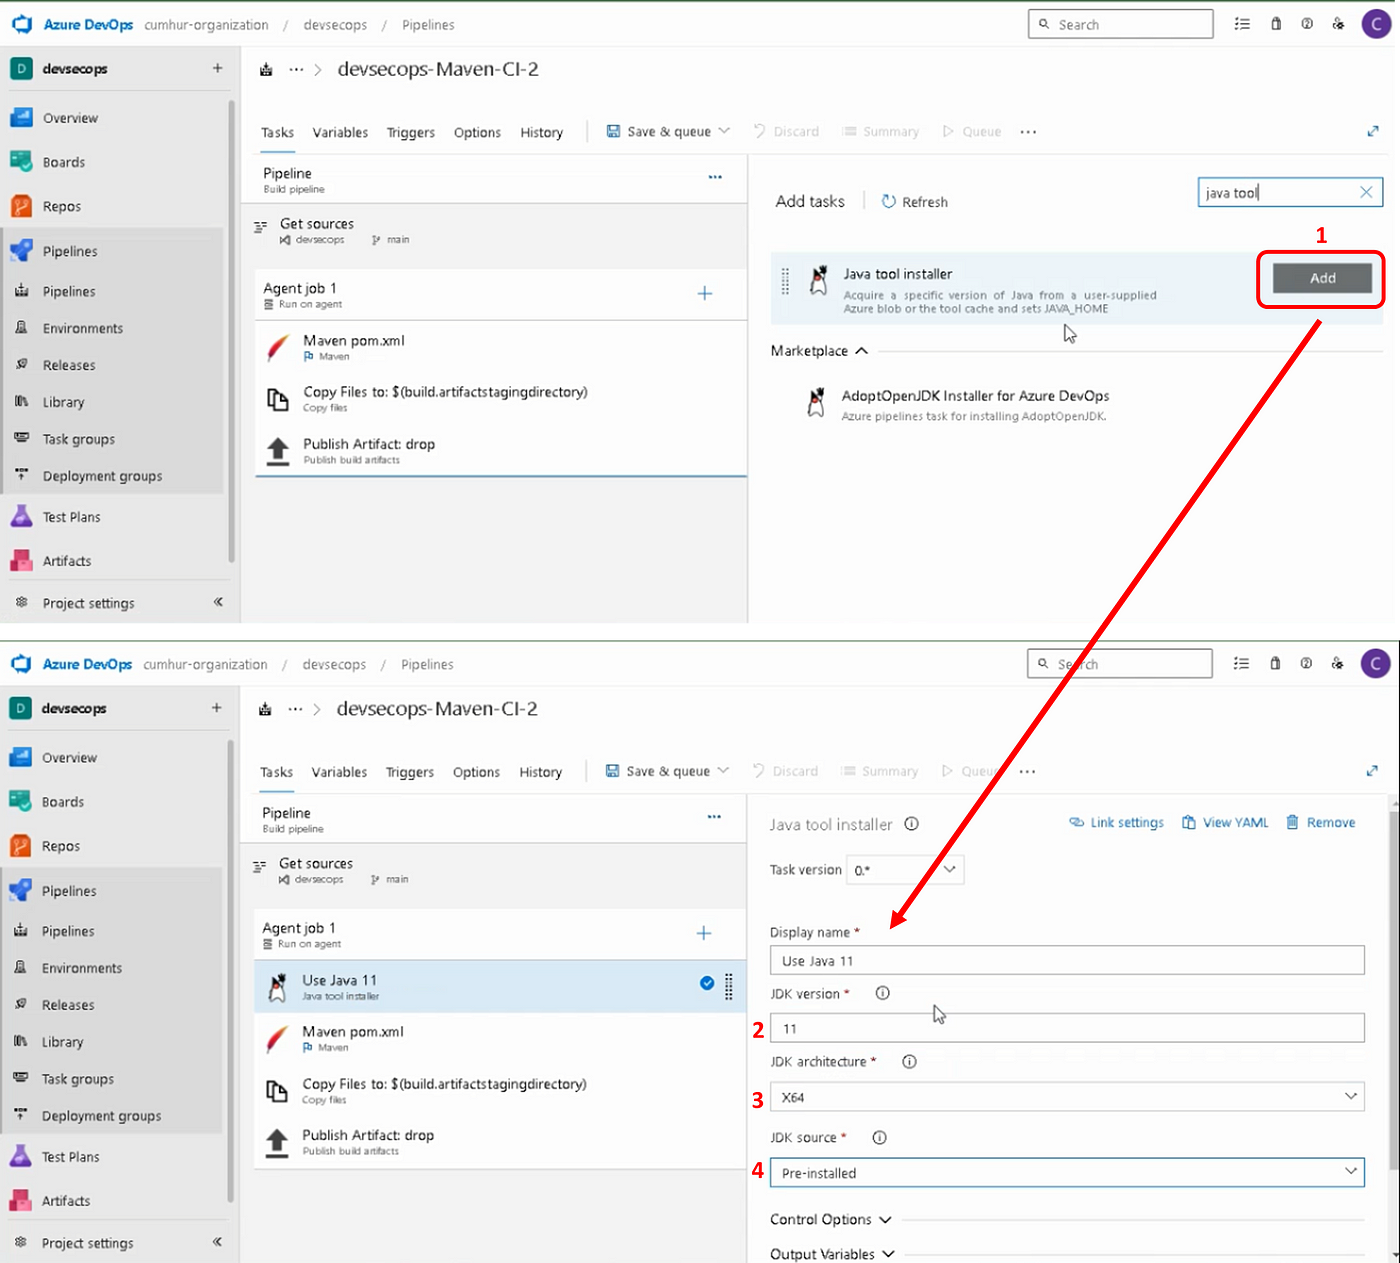
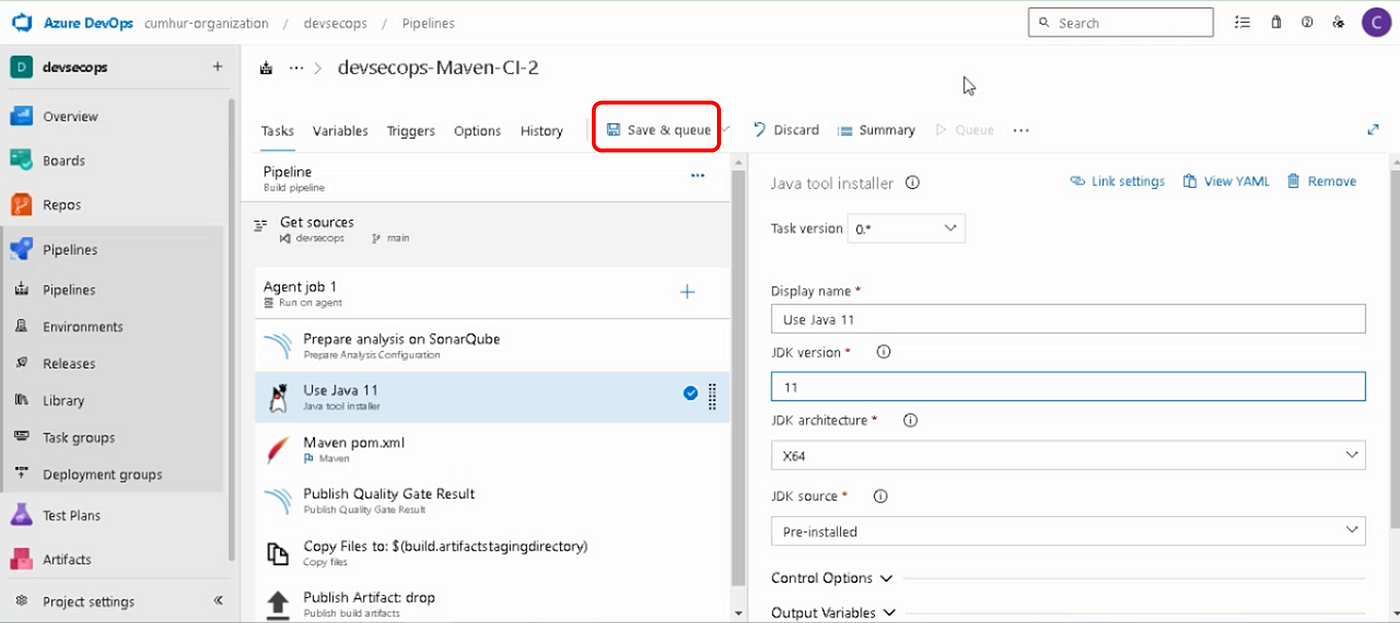
d. Adding a New “Java tool installer” Task
Add “Java tool installer” task in Azure Pipelines, as shown in Figure 11. Then, under JDK version, select 11 (or higher) (Note: I used the Java11 version because my Java application also gave errors in the Java17 version.), under JDK architecture, select x64, under JDK source, select Pre-installed, as shown in Figure 11.
e. Adding and Preparing SonarQube “Prepare Analysis Configuration” Task
Add the “Prepare Analysis Configuration” task in Azure Pipelines, as shown in Figure 12.
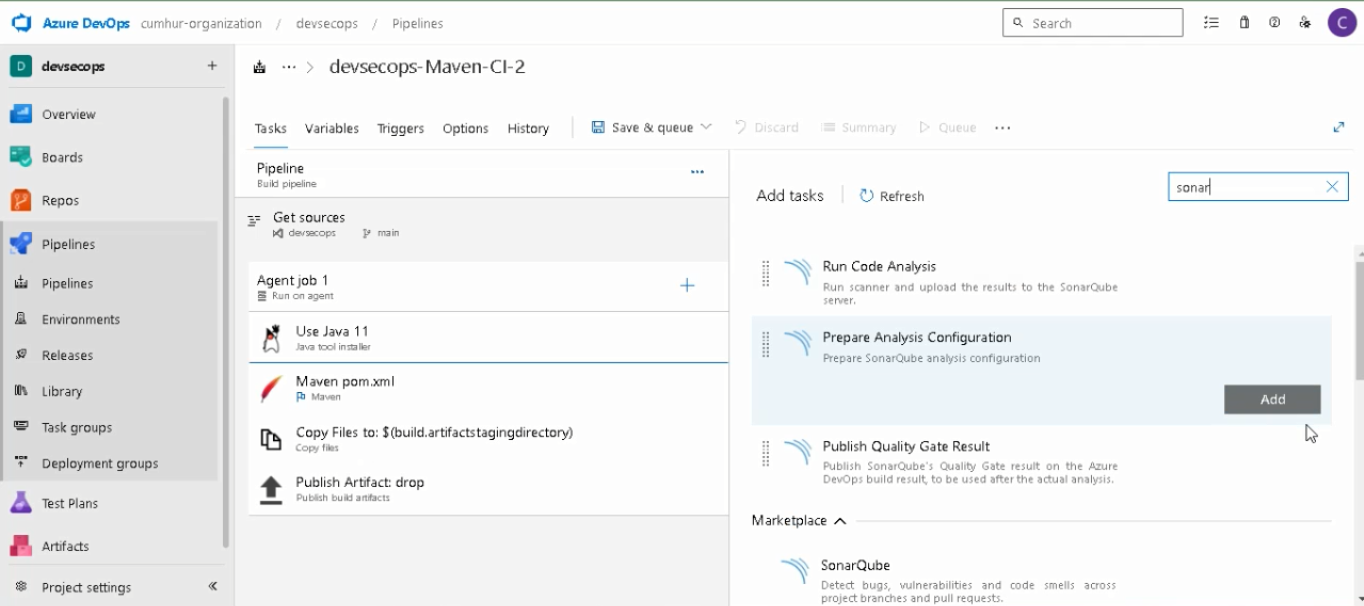
Enter a display name, as shown in Figure 13. Select the SonarQube server endpoint we created in Step “1.c.”
Then, choose “Integrate with Maven or Gradle” to run the analysis. Finally, expand the “Advanced section” and add the Additional Properties with the following snippet, as shown in Figure 13.
Note: They must be your project name.
sonar.projectKey=sonar-aks-projects
sonar.projectName=sonar-aks-projects
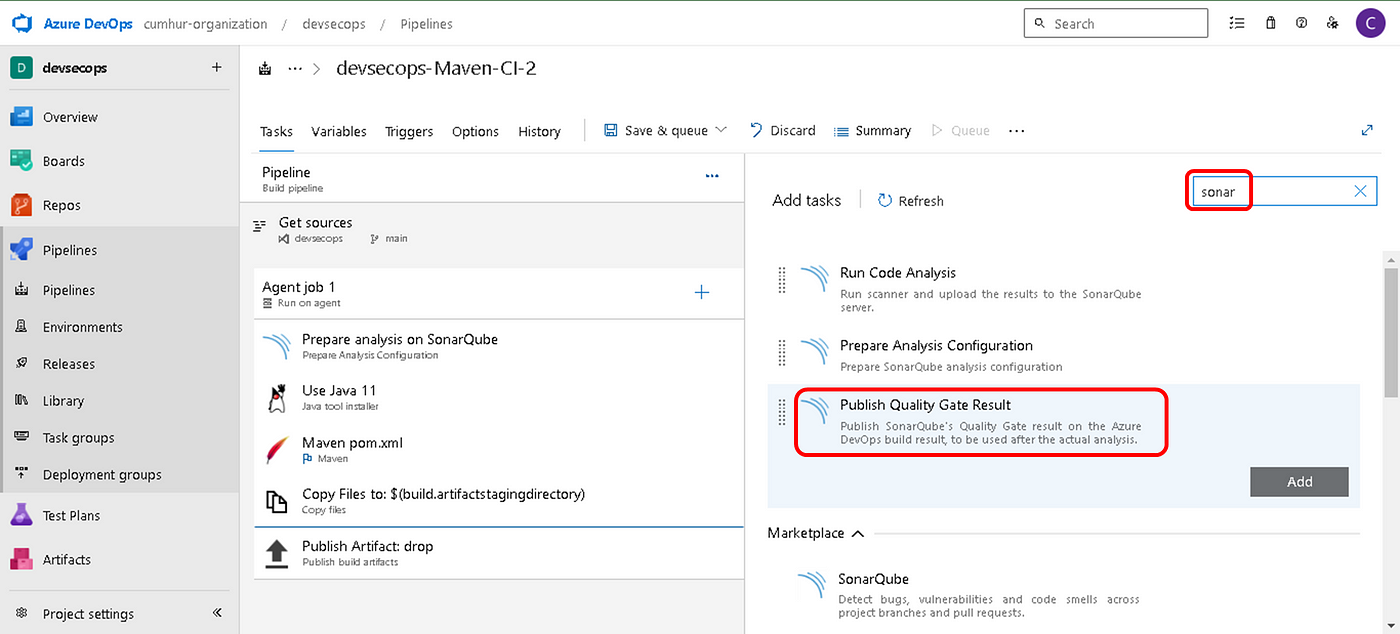
f. Adding and Preparing “Publish Quality Gate Result” Task
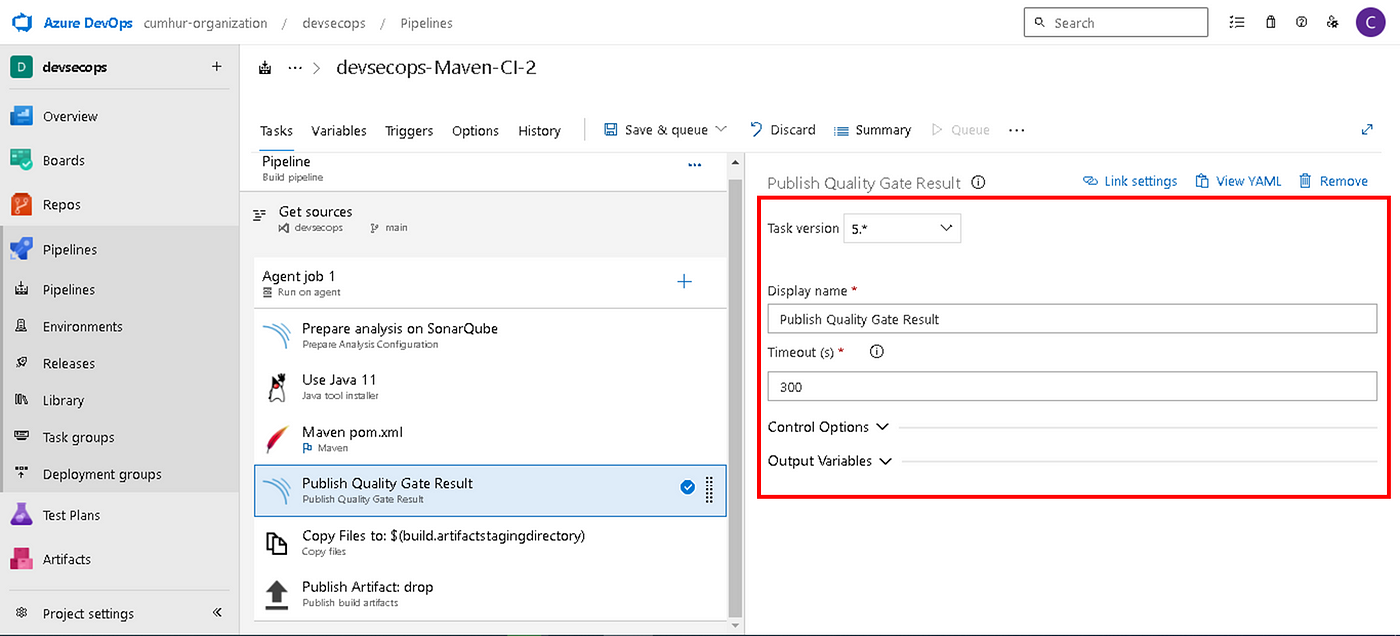
Add a new “Publish Quality Gate Result” task to publish SonarQube’s Quality Gate results on your build pipeline summary (optional), as shown in Figure 14.
Leave values as default, as shown in Figure 15. Our Azure Pipeline is now ready for SonarQube analysis.
g. Enabling Continuous Integration in Azure Pipelines
Under the “Triggers” tab of your pipeline, check “Enable continuous integration” and select the “main” branch, as shown in Figure 16.
Thus, we will ensure automatic triggering. When something is pushed to the main branch, the Azure pipeline will automatically be triggered and start running.

3. Running Azure Pipelines for SonarQubeAnalysis
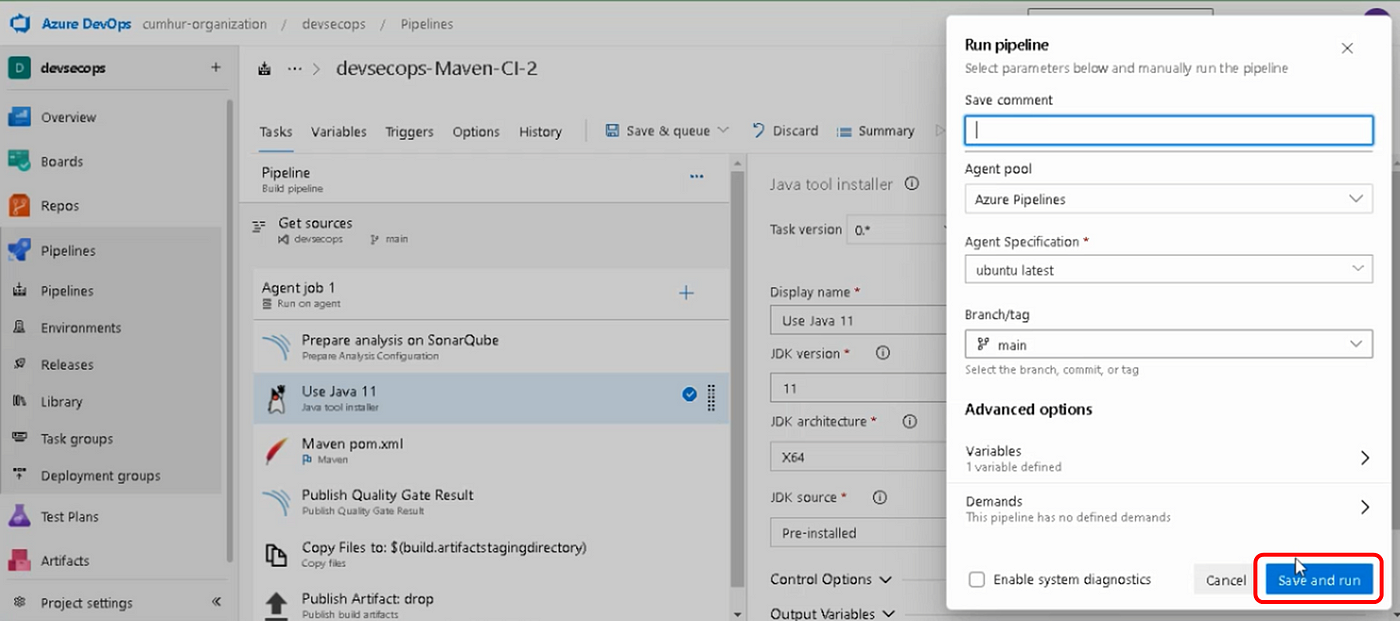
Click on the “Save & queue” button in Azure Pipelines to analyze with SonarQube our Java application code, as shown in Figure 17.
Click on the “Save & queue” button to start SonarQube Analysis, as shown in Figure 18.
Our pipeline started running, as shown in Figure 19. Click on the “Apply Job 1” to see the pipeline flow.
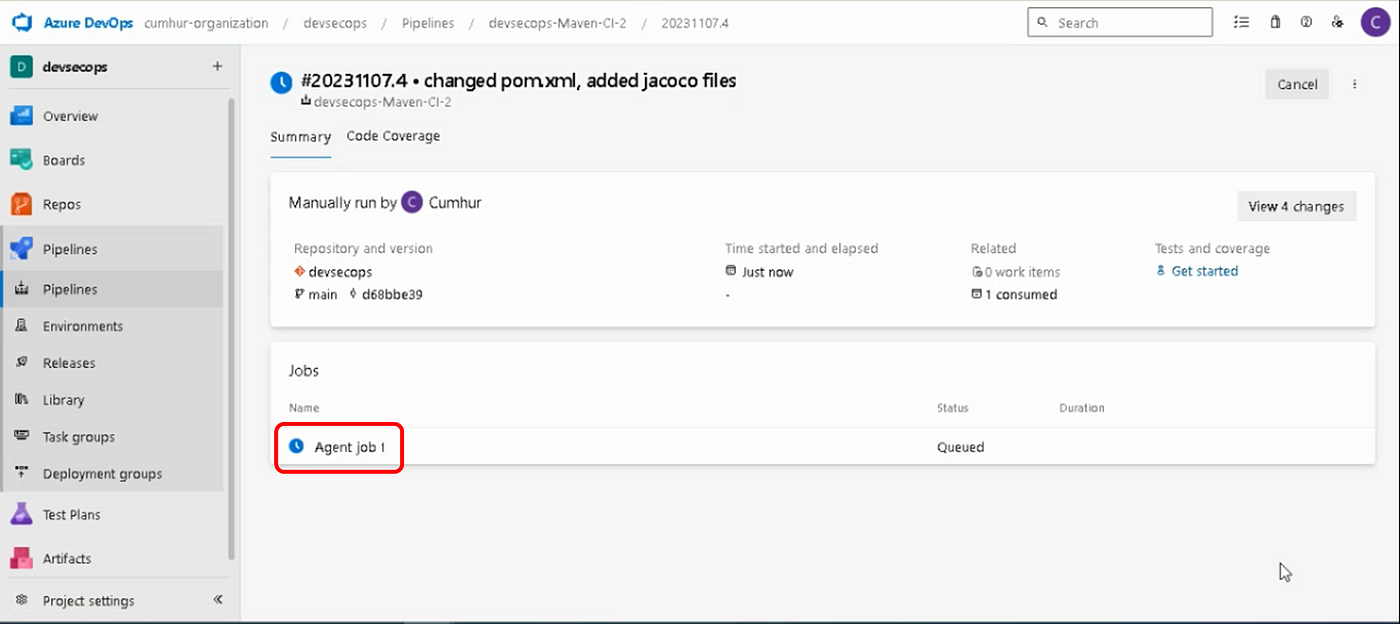
Our pipeline successfully completed all the tasks we finished the “devsecops pipeline”, as shown in Figure 20.

4. Examining and Evaluating The Test Results From The SonarQube Dashboard
Click on the “Projects” button in the SonarQube Dashboard, and then select our project “sonar-aks-projects”, as shown in Figure 21.

“sonar-aks-projects” project home page is opened, as shown in Figure 22.
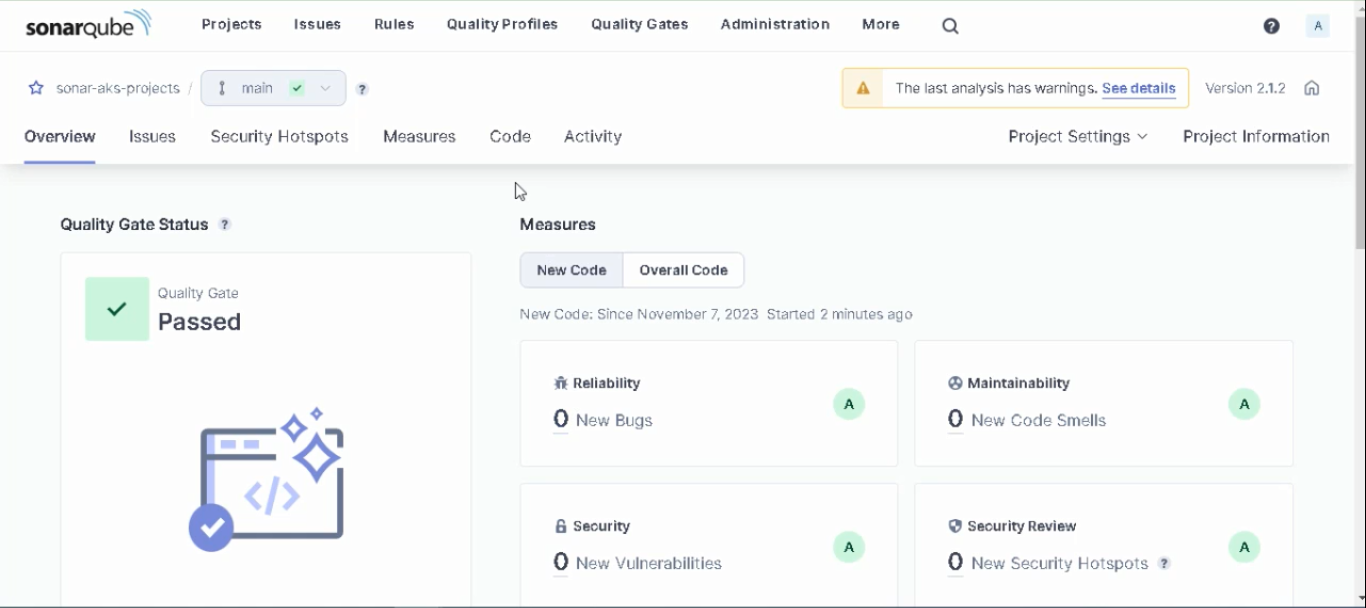
We can see SonarQube analysis results in the “Overall Code” section.

Projects are evaluated on SonarQube with letter grades. We can evaluate the results on the Project screen (in Figure 23) as follows: (8)
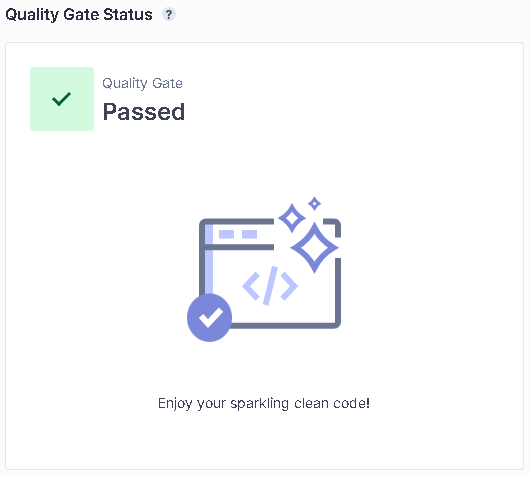
Quality Gate: It decides whether our projects are successful or unsuccessful as a result of sonar scanning. Our result: “Passed”, as shown in Figure 24.
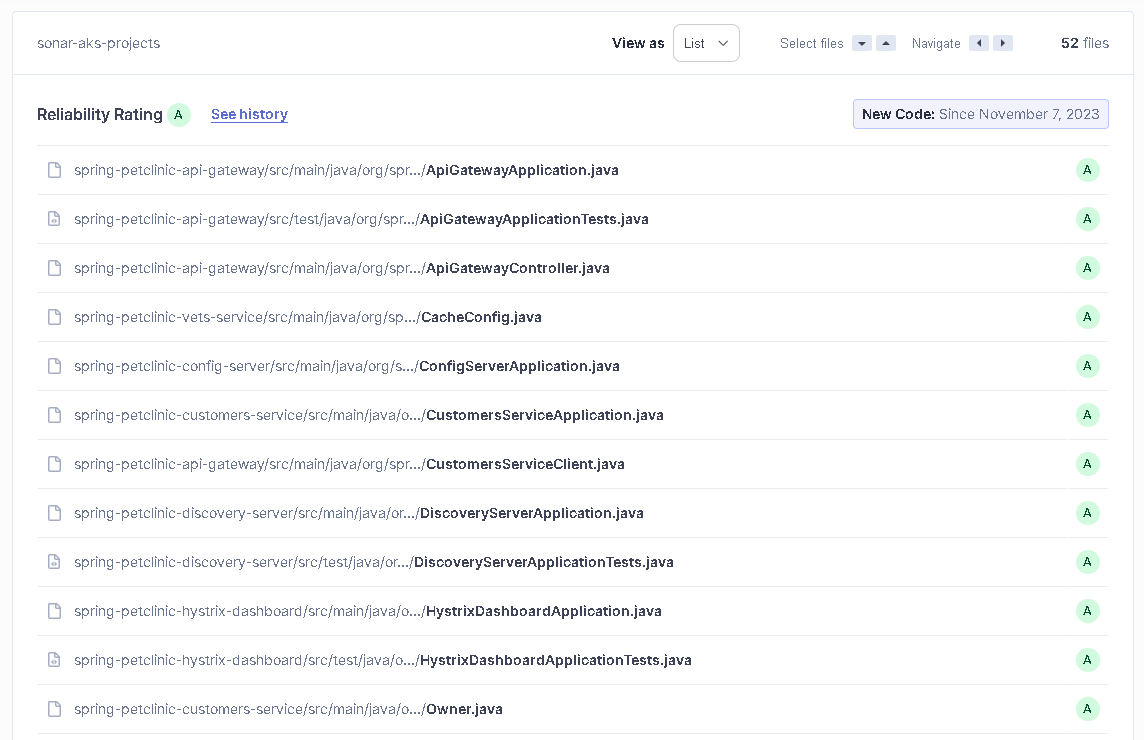
Reliability (Bugs): It marks points in the scanned code that need to be corrected and may cause problems in the future. Our result: “A”, as shown in Figure 25, the Reliability rating is A when there are no bugs.
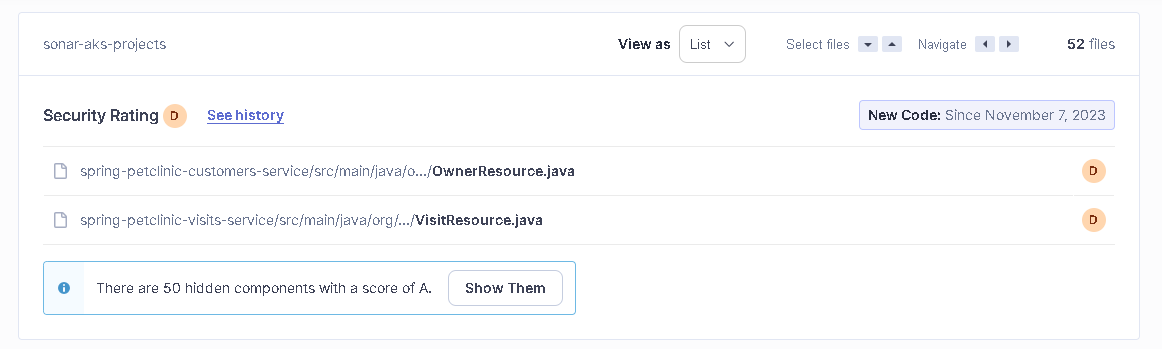
Vulnerability (Security): It indicates findings that may create a backdoor according to best practice security rules. Our result: “D”, as shown in Figure 26, Security rating is D when there is at least one critical vulnerability.
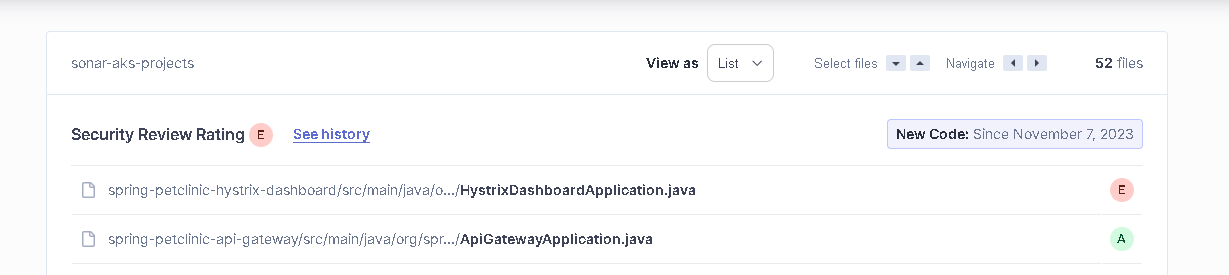
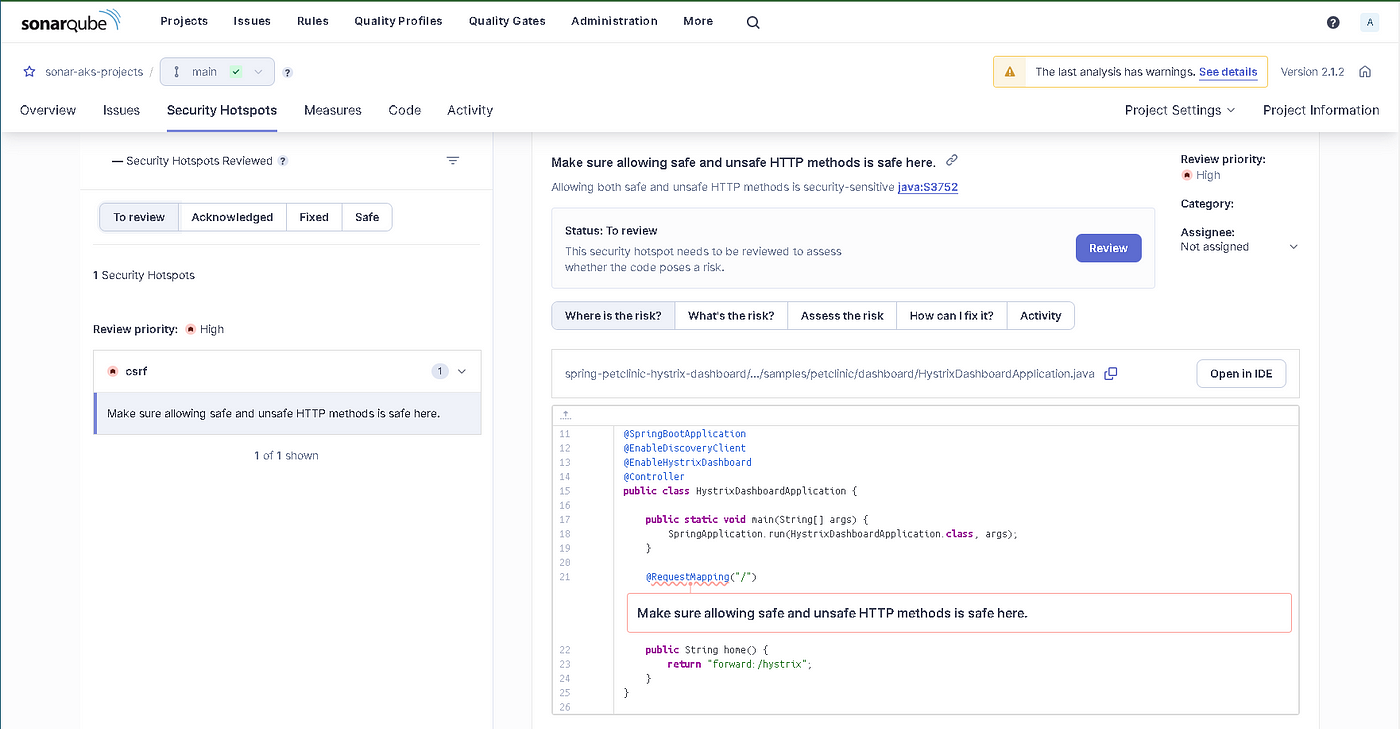
Security Hotspot (Security Review): It indicates security findings that should be reviewed. It requires review to prevent security vulnerabilities. Our result: “E”, as shown in Figures 27–28, the Security Review rating is E when less than 30% of Security Hotspots are reviewed.
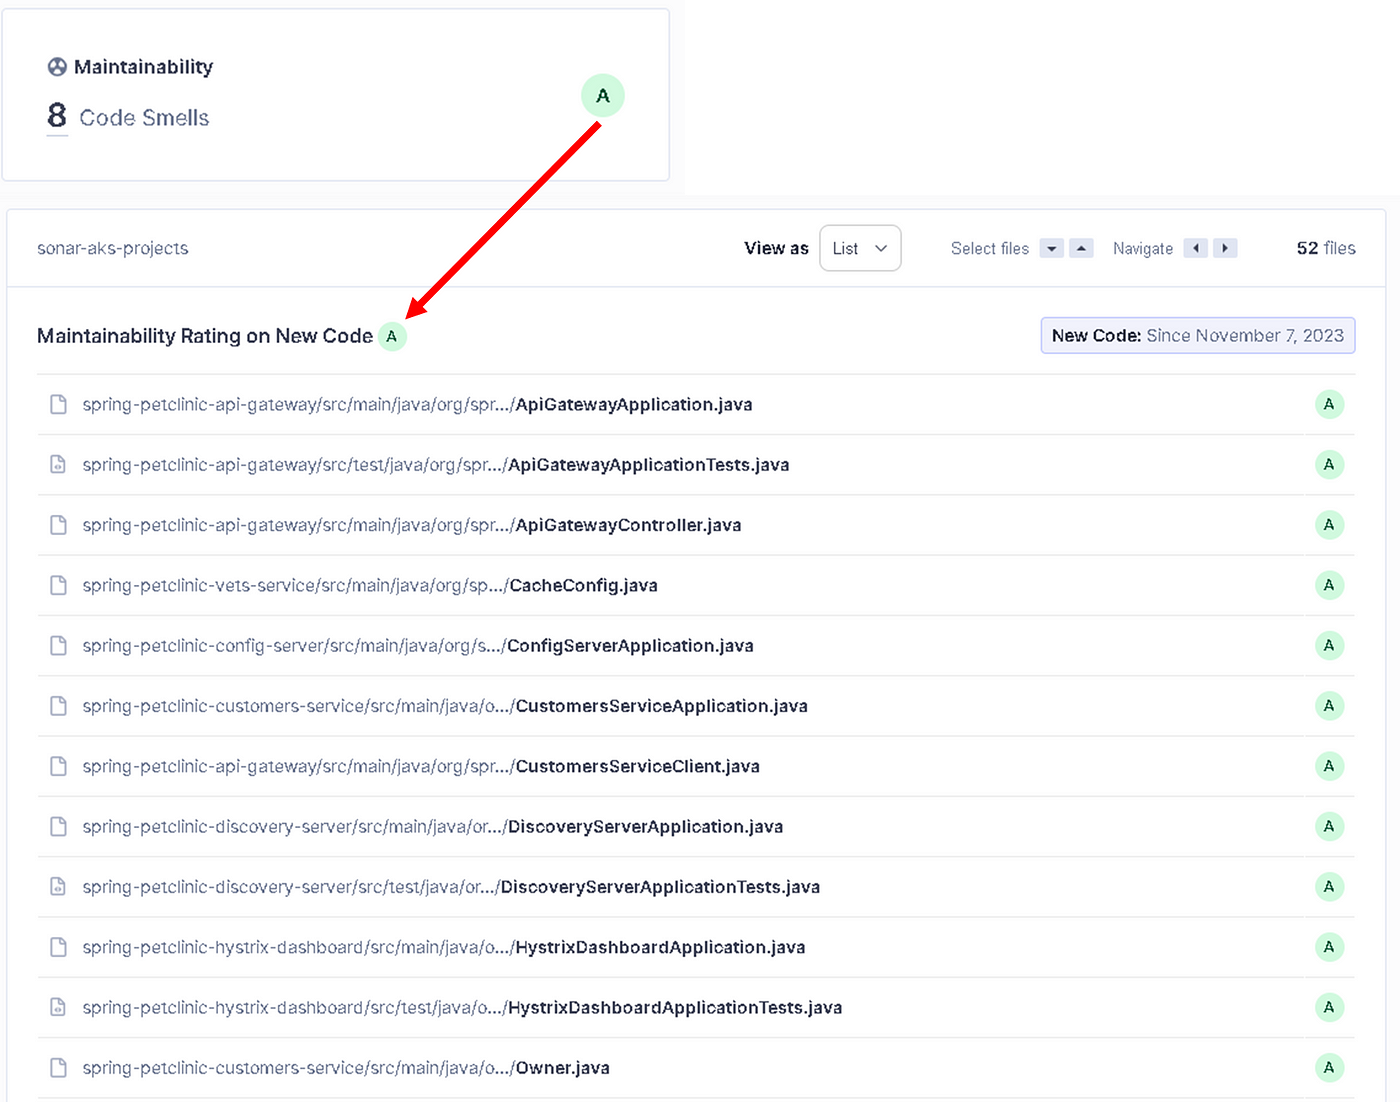
Maintainability: I can easily update this project and use it with new technologies. Our result: “A”, as shown in Figure 29, the Maintainability rating is A when the technical debt ratio is less than 5.0%
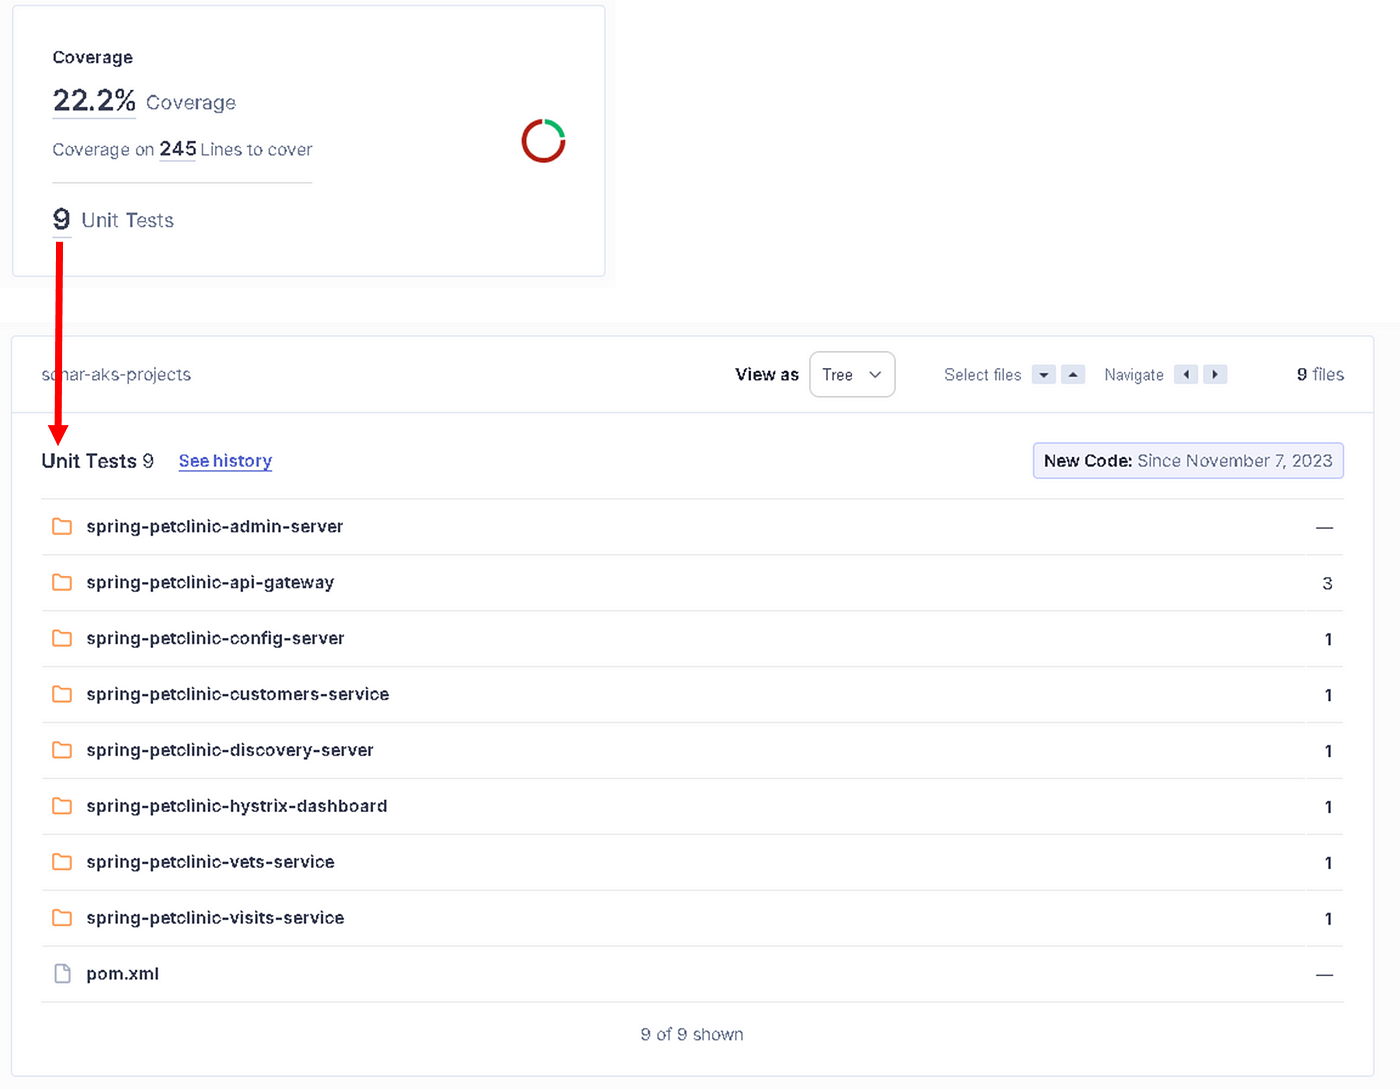
Coverage: It shows what percentage of the code has been tested with unit testing. Our result: “22.2%”, as shown in Figure 30, Coverage on 245 Lines to cover in our source code.
Duplication: It shows how many blocks have been copied exactly in the source code. Our result: “Green”, as shown in Figure 31, 1.1%Duplications, Duplications on 1.8k Lines.

Code Smells: It indicates fixes for code maintainability, as shown in Figure 32. It marks the points required for clean code that need to be resolved in order to reduce maintenance and readability costs in the code in the future.
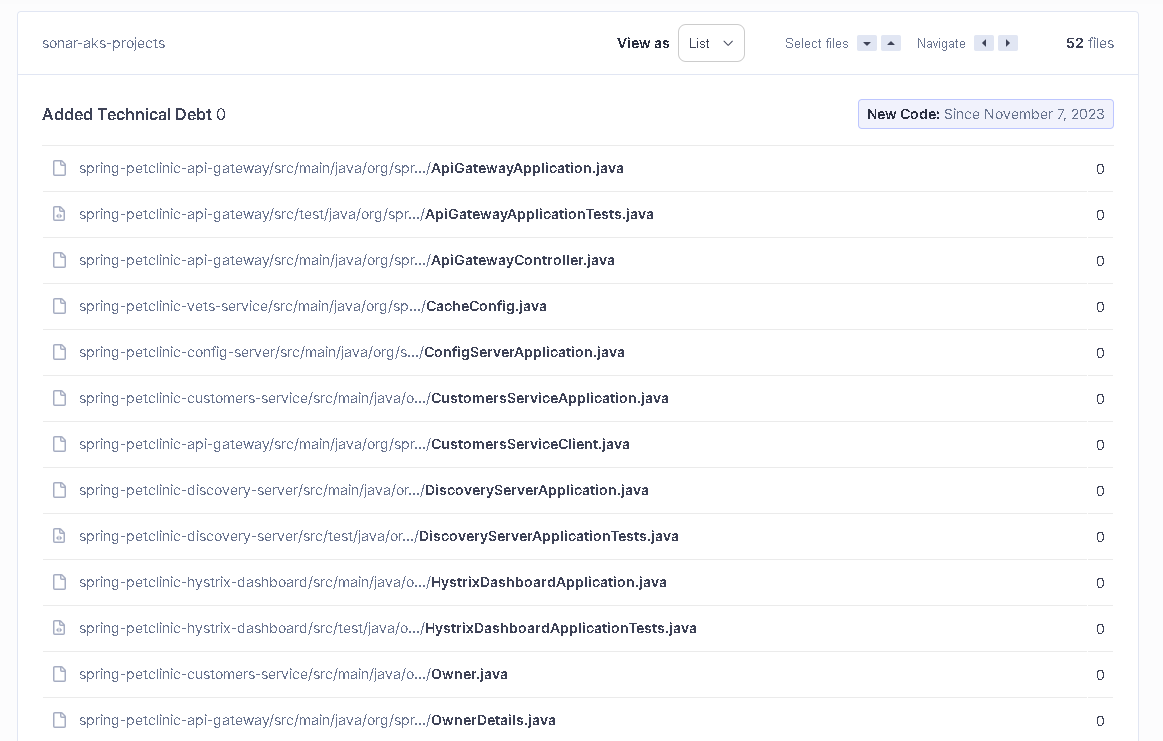
Debt: It shows the approximate time cost to fix code smells, as shown in Figure 33.
5. As a result
We integrated the SonarQube Server with Postgresql Database into the Azure Pipeline. Then, we created and ran the Azure pipeline for SonarQube analysis. Finally, we examined and evaluated the test results in the Sonarqube dashboard.
Your clap, follow, or subscribe, they help my articles to reach the broader audience. Thank you in advance for them.
6. Next post
In the next post, “DevSecOps-3: Code Coverage and Running Jacoco Plugin in Sonarqube and Project’s pom.xml File”, as shown in Figure 34. We will learn detailed information about Code Coverage and Running Jacoco Plugin. Then, we will integrate the Jacoco Plugin into the java application’s pom.xml file, and run the Jacoco plugin in Sonarqube. We will do them practically and step by step.
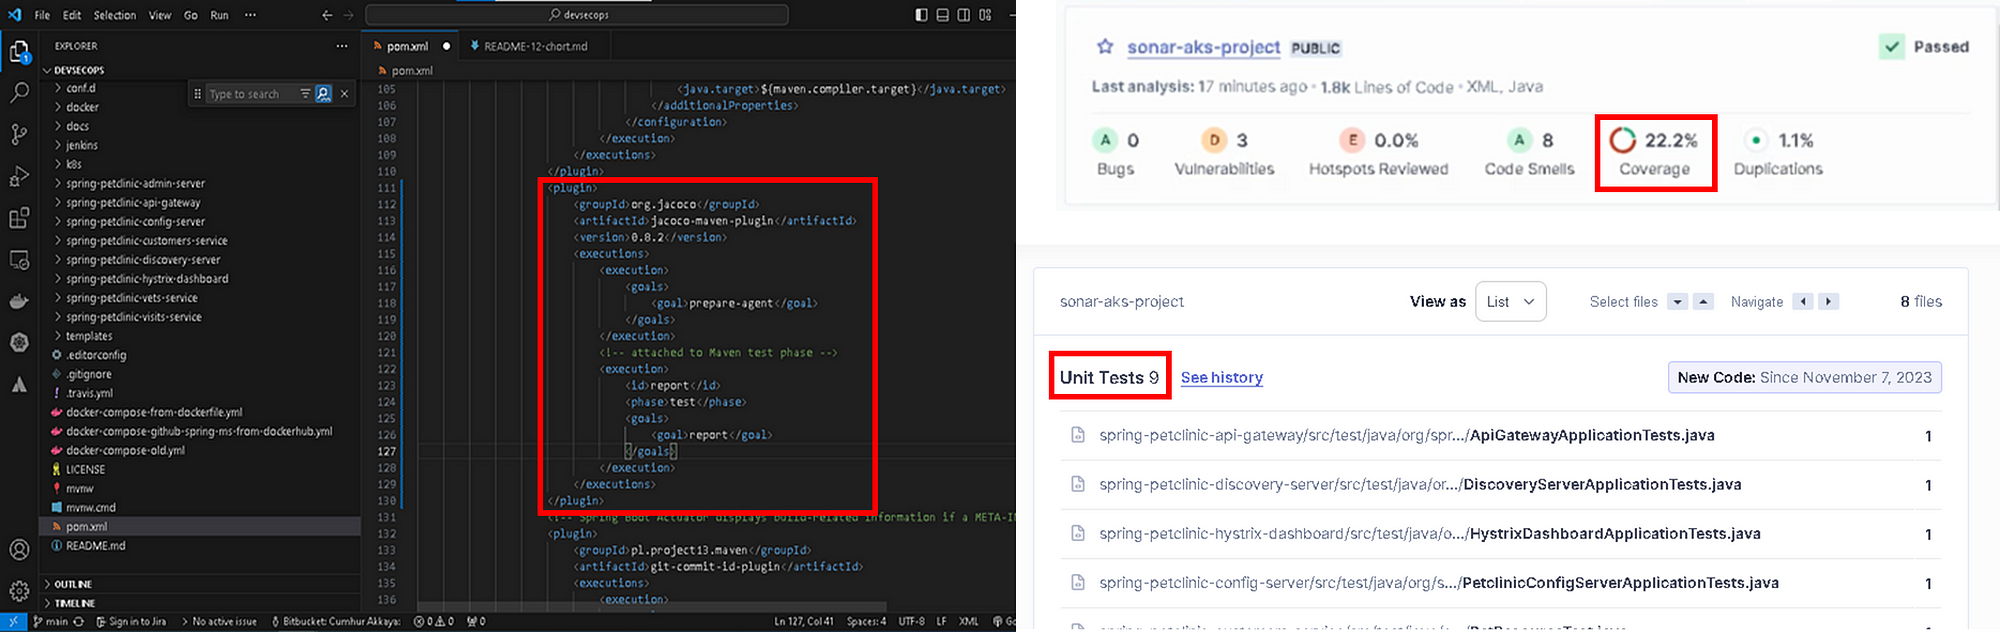
Figure 34— “DevSecOps-3: Code Coverage and Running Jacoco Plugin in Sonarqube and Project’s pom.xml File”
In the fourth post, “DevSecOps-4: Running Sonarqube Scanner, OWASP Dependency Check, Jacoco, and Trivy in Jenkins CI/CD Pipeline.”, as shown in Figure 35. We will integrate Sonarqube Scanner, OWASP Dependency Check, Jacoco, and Trivy into Jenkins, and run them in Jenkins CI/CD Pipeline in order to analyze the codes and images of a Microservice Java application. We will do them practically and step by step, as shown in Figures 36–37–38.
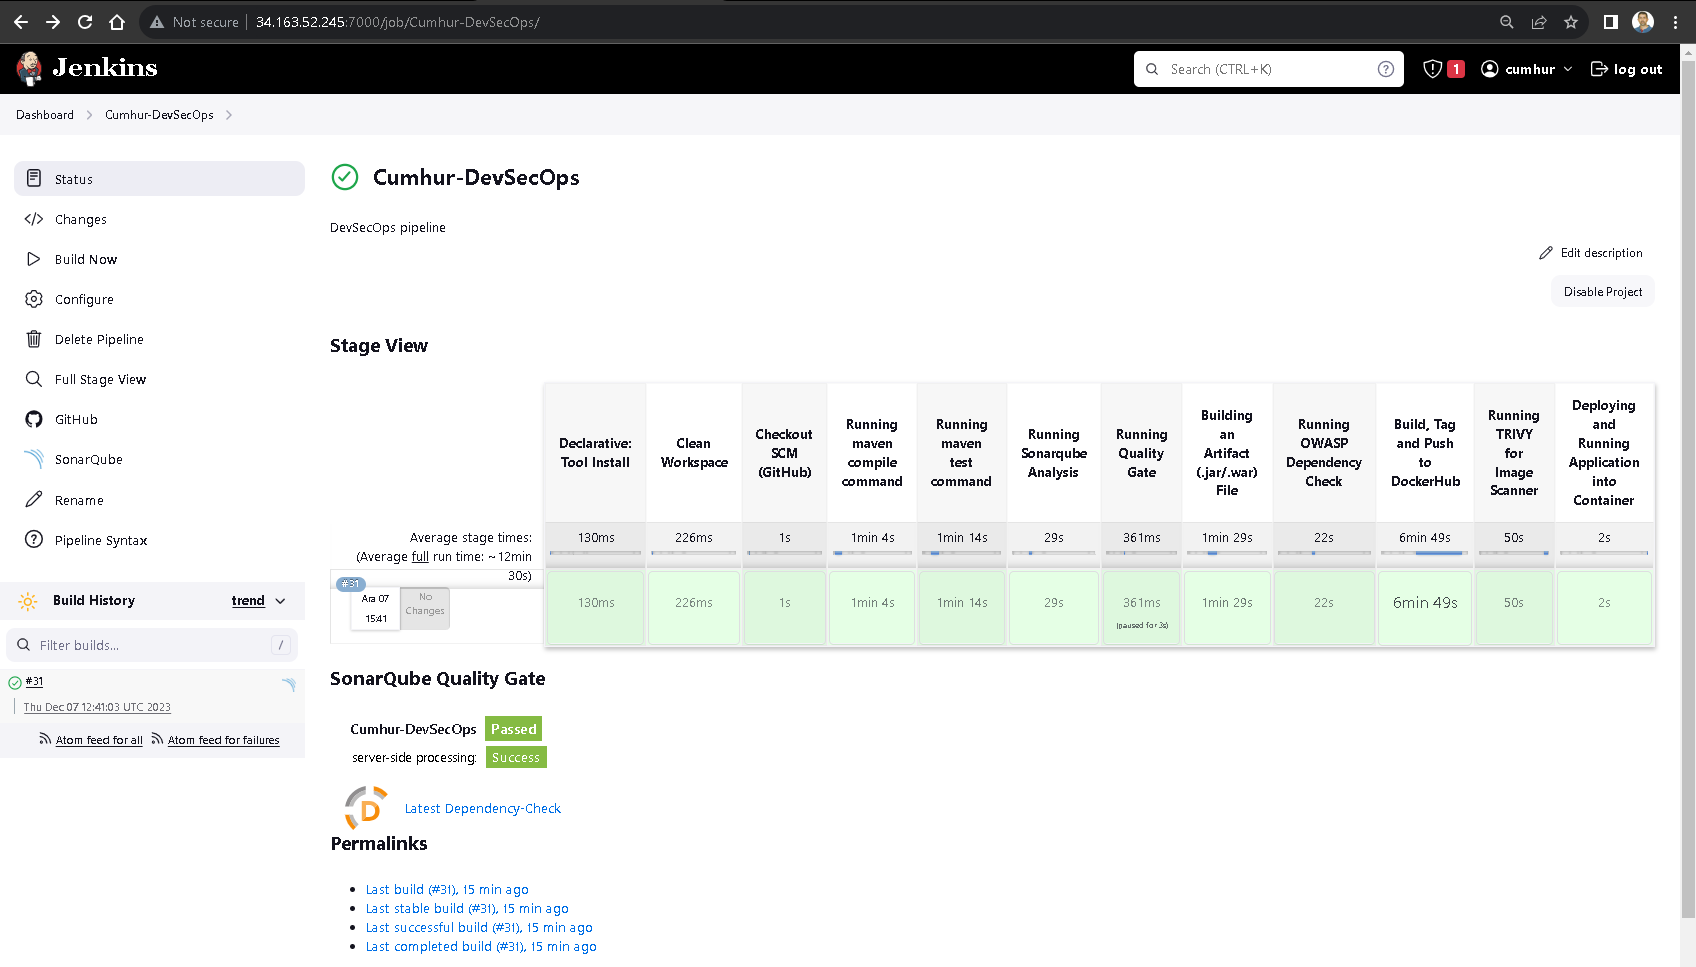
Figure 35 - “DevSecOps-4: Running Sonarqube Scanner, OWASP Dependency Check, Jacoco, and Trivy in Jenkins CI/CD Pipeline.”
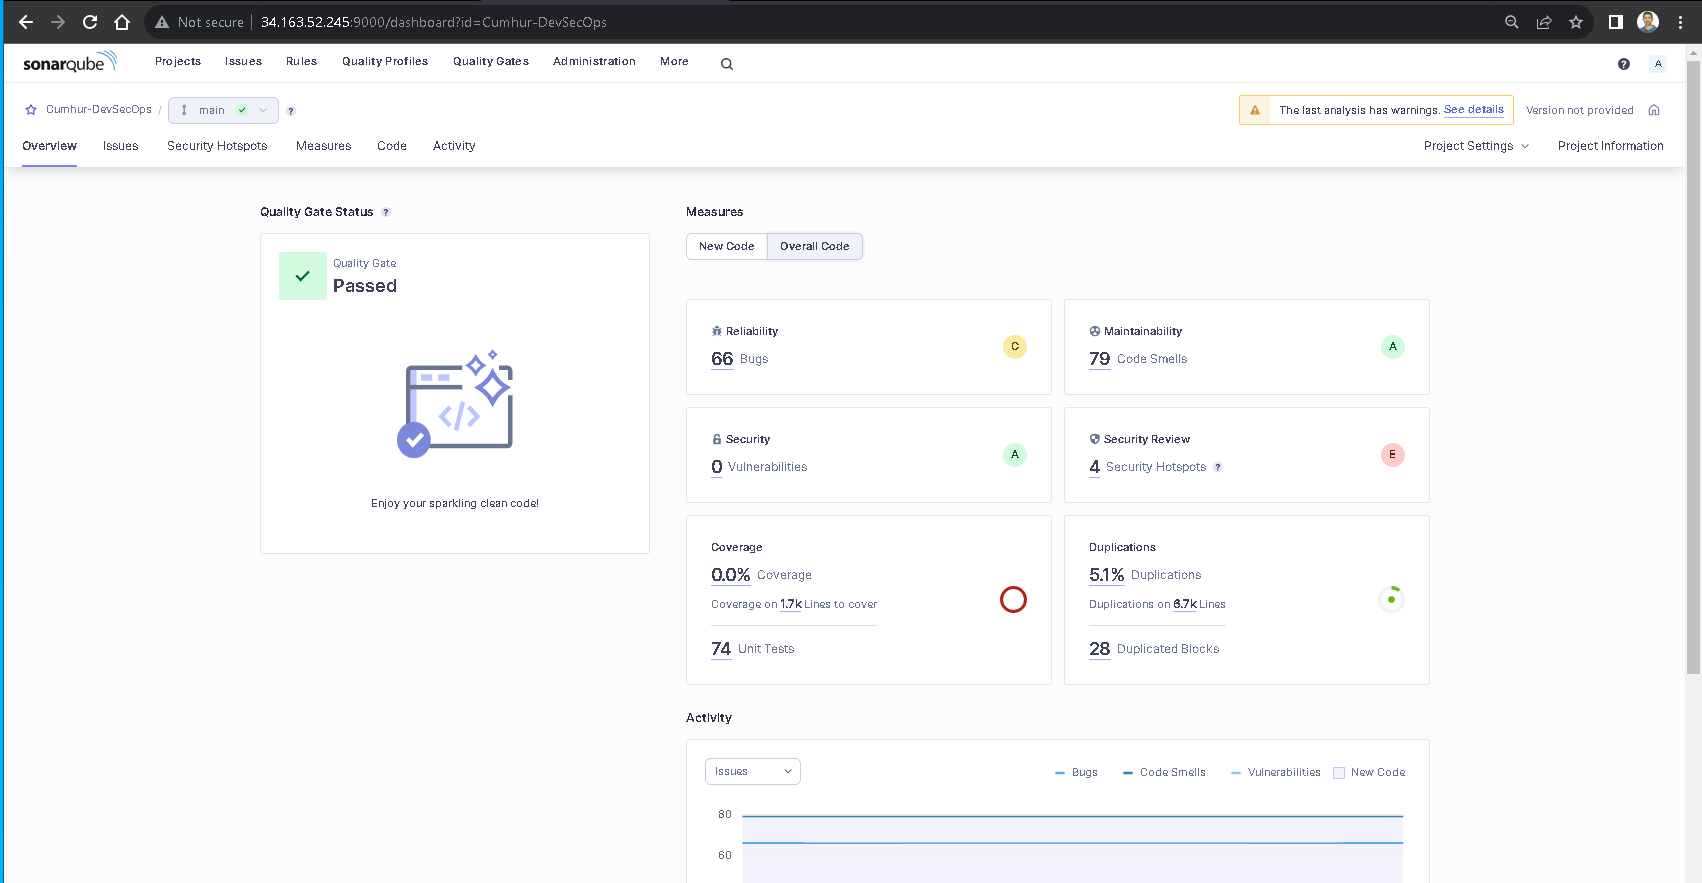
Figure 36 — Sonarqube Analysis and Quality Gate Results
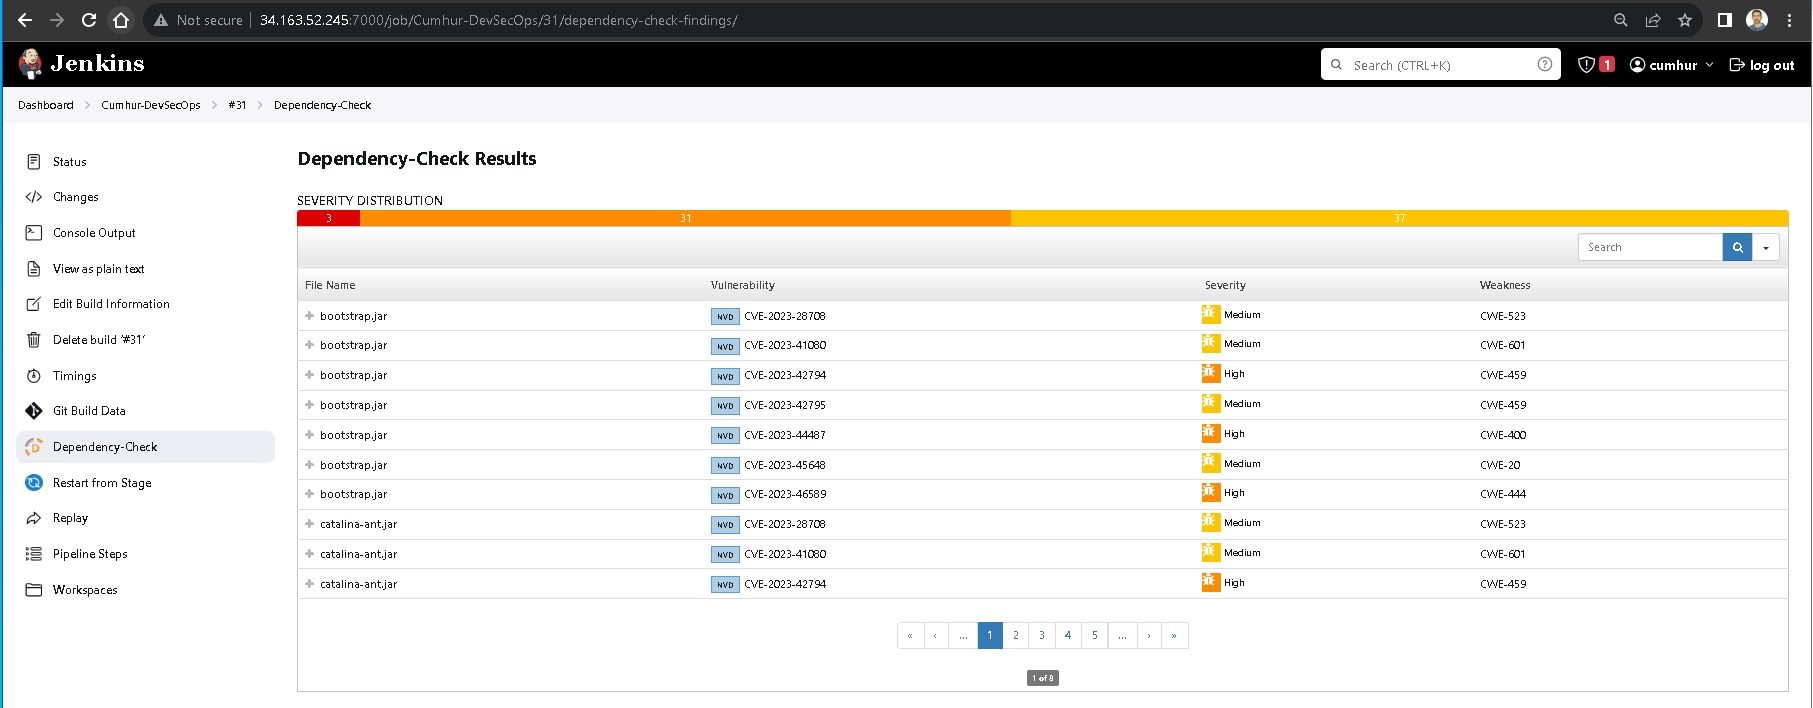
Figure 37 -OWASP Dependency-Check Results
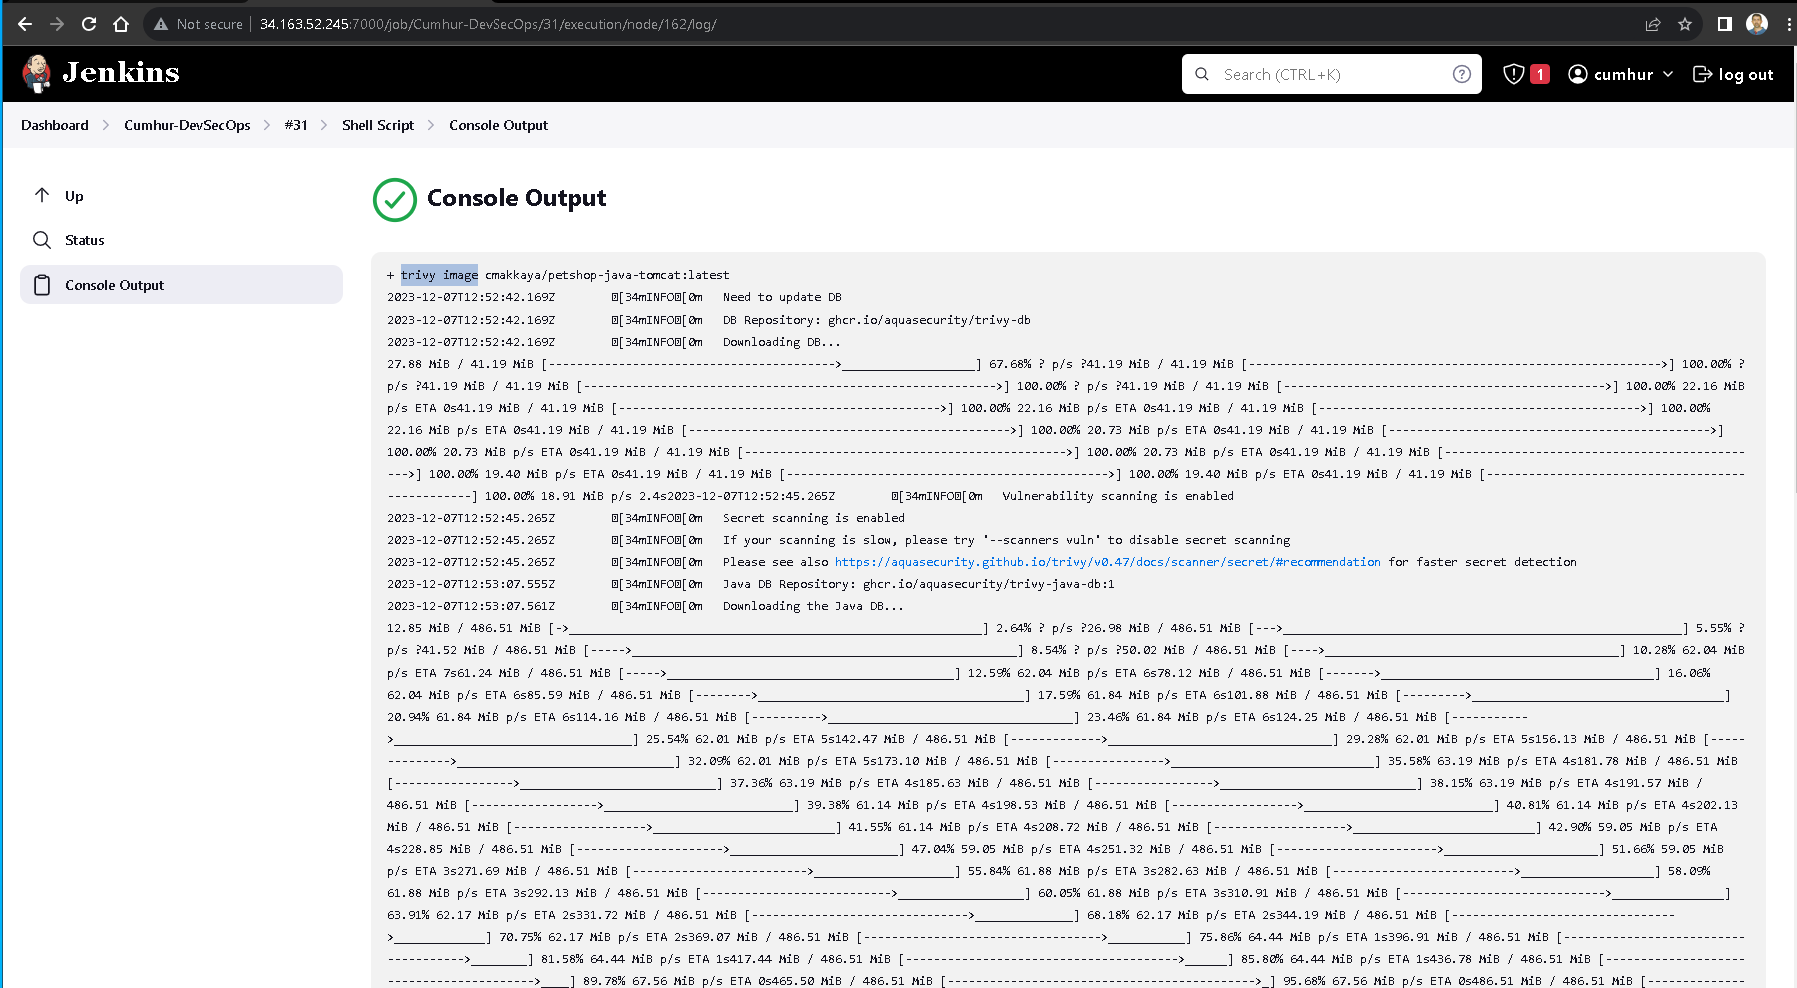
Figure 38 -Trivy Results
Happy Clouding…
References
(1a) https://expertinsights.com/insights/the-top-10-devsecops-tools-for-application-security/
(1b) https://docs.sonarsource.com/sonarqube/latest/
(2) https://ranjaniitian.medium.com/top-devsecops-tools-for-2023-open-source-solutions-for-enterprises-7c146f80b325
(3) https://aquasecurity.github.io/trivy/v0.47/
(4) https://www.linkedin.com/posts/suraj-joshi-673457154_devsecops-deploying-the-swiggy-clone-app-ugcPost-7123504083574874112-ZFIf/?utm_source=share&utm_medium=member_android
(5) https://owasp.org/www-project-dependency-check/
(6) https://www.jacoco.org/jacoco/trunk/doc/agent.html
(7) https://docs.sonarsource.com/sonarqube/10.2/devops-platform-integration/azure-devops-integration/
(8) https://medium.com/@korhanherguner/sonarqube-7f9eca8ae9cc
(8) https://ranjaniitian.medium.com/top-devsecops-tools-for-2023-open-source-solutions-for-enterprises-7c146f80b325
(1a) https://expertinsights.com/insights/the-top-10-devsecops-tools-for-application-security/
(1b) https://docs.sonarsource.com/sonarqube/latest/
(9) https://aquasecurity.github.io/trivy/v0.47/
(10) https://www.linkedin.com/posts/suraj-joshi-673457154_devsecops-deploying-the-swiggy-clone-app-ugcPost-7123504083574874112-ZFIf/?utm_source=share&utm_medium=member_android
(11) https://owasp.org/www-project-dependency-check/
(12) https://www.jacoco.org/jacoco/trunk/doc/agent.html
(13) https://docs.sonarsource.com/sonarqube/latest/
(14) https://scm.thm.de/sonar/documentation/architecture/architecture-integration/
(15) https://scm.thm.de/sonar/documentation/architecture/architecture-integration/
(16) https://docs.sonarsource.com/sonarqube/latest/setup-and-upgrade/install-the-server/